by Calculated Risk on 9/10/2020 04:27:00 PM
Thursday, September 10, 2020
Hotels: Occupancy Rate Declined 19% Year-over-year; Boosted by Hurricane and Fires
From HotelNewsNow.com: STR: US hotel results for week ending 5 September
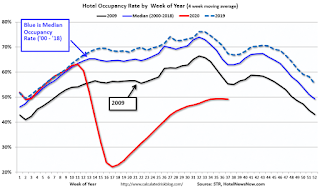
Boosted in part by Labor Day weekend, U.S. hotel occupancy increased slightly over the previous week, according to the latest data from STR.The following graph shows the seasonal pattern for the hotel occupancy rate using the four week average.
30 August through 5 September 2020 (percentage change from comparable week in 2019):
• Occupancy: 49.4% (-18.9%)
• Average daily rate (ADR): US$100.97 (-17.1%)
• Revenue per available room (RevPAR): US$49.87 (-32.8%)
Hotel demand grew to 18 million room nights sold (+500,000 week over week). Saturday (5 September) occupancy came in at 69.0%, just 2.6% less than the comparable Saturday in 2019, and leisure markets that have showed the highest summer occupancy levels reported strong increases from the previous weekend. At the same time, the markets with the highest occupancy for the week were not leisure destinations. Rather, the high occupancy markets were those housing displaced residents from Hurricane Laura and the California wildfires.
emphasis added
 Click on graph for larger image.
The red line is for 2020, dash light blue is 2019, blue is the median, and black is for 2009 (the worst year probably since the Great Depression for hotels).
The leisure travel season usually peaks at the beginning of August, and then the occupancy rate typically declines sharply in the Fall. However, with so many schools closed (or openings delayed), the leisure travel season lasted longer than usual this year. It seems unlikely business travel will pickup significantly in the Fall.
Note: Y-axis doesn't start at zero to better show the seasonal change.


