 RSS Feed
 by Calculated Risk on 3/05/2021 08:44:00 AM
Friday, March 05, 2021
February Employment Report: 379 Thousand Jobs, 6.2% Unemployment Rate
From the BLS:
Total nonfarm payroll employment rose by 379,000 in February, and the unemployment rate was little changed at 6.2 percent, the U.S. Bureau of Labor Statistics reported today. The labor market continued to reflect the impact of the coronavirus (COVID-19) pandemic. In February, most of the job gains occurred in leisure and hospitality, with smaller gains in temporary help services, health care and social assistance, retail trade, and manufacturing. Employment declined in state and local government education, construction, and mining.
...
The change in total nonfarm payroll employment for December was revised down by 79,000, from -227,000 to -306,000, and the change for January was revised up by 117,000, from +49,000 to +166,000. With these revisions, employment in December and January combined was 38,000 higher than previously reported.
emphasis added
 Click on graph for larger image.
The first graph shows the year-over-year change in total non-farm employment since 1968.
In February, the year-over-year change was negative 9.475 million jobs.
Total payrolls increased by 379 thousand in February. Private payrolls increased by 465 thousand.
Payrolls for December and January were revised up 38 thousand, combined.
 The second graph shows the job losses from the start of the employment recession, in percentage terms.
The current employment recession was by far the worst recession since WWII in percentage terms, and is still at the worst of the "Great Recession".
The third graph shows the employment population ratio and the participation rate.
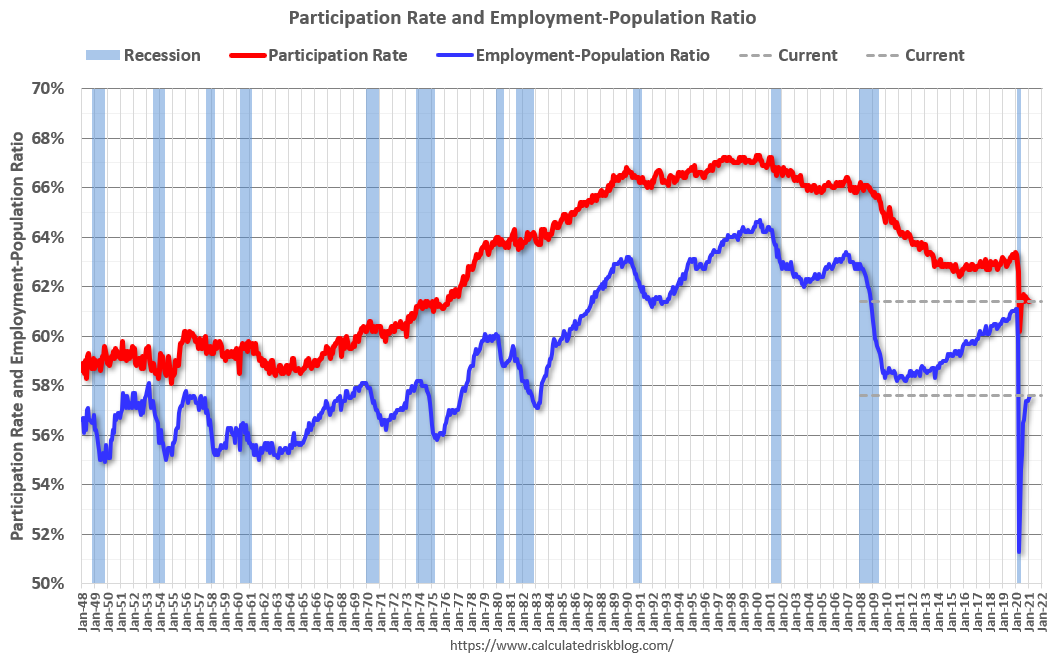 The Labor Force Participation Rate was unchanged at 61.4% in February. This is the percentage of the working age population in the labor force.
 The Employment-Population ratio increased to 57.6% (black line).
I'll post the 25 to 54 age group employment-population ratio graph later.
 The fourth graph shows the unemployment rate.
 The unemployment rate decreased in February to 6.2%.
This was well above consensus expectations, and December and January were revised up by 38,000 combined.
I'll have more later ...


