by Calculated Risk on 6/04/2021 12:59:00 PM
Friday, June 04, 2021
AAR: May Rail Carloads down, Intermodal Up Compared to 2019
From the Association of American Railroads (AAR) Rail Time Indicators. Graphs and excerpts reprinted with permission.
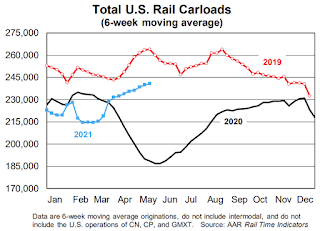
U.S. rail volumes in May 2021 were encouraging. Total originated carloads averaged 241,089 per week, the most since October 2019 and up 30.4% over May 2020.
...
Meanwhile, intermodal averaged 287,956 originated containers and trailers per week in May 2021. That’s down a bit from April — when the weekly average of 293,488 set a new all-time record — but it’s still the seventh most for any month in history and by far the most ever for May.
emphasis added
 Click on graph for larger image.
This graph from the Rail Time Indicators report shows the six week average of U.S. Carloads in 2019, 2020 and 2021:
In May 2021, total U.S. rail carloads averaged 241,089 per week — up 30.4% over May 2020 and the most for any month since October 2019.
...
Carloads excluding coal were up 26.6% in May 2021 over May 2020 and down 1.2% from May 2019.
 The second graph shows the six week average of U.S. intermodal in 2019, 2020 and 2021: (using intermodal or shipping containers):
For intermodal, volumes in May 2021 were up 26.2% over May 2020, averaging 287,956 containers and trailers per week. That’s down a bit from April 2021 — when the weekly average of 293,488 set a new all-time monthly record — but it’s still the seventh most for any month in history and by far the most ever for May.


