by Calculated Risk on 10/31/2023 09:30:00 AM
Tuesday, October 31, 2023
Case-Shiller: National House Price Index Up 2.6% year-over-year in August; New all-time High
S&P/Case-Shiller released the monthly Home Price Indices for August ("August" is a 3-month average of June, July and August closing prices).
This release includes prices for 20 individual cities, two composite indices (for 10 cities and 20 cities) and the monthly National index.
From S&P S&P CoreLogic Case-Shiller Index Continues to Trend Upward in August

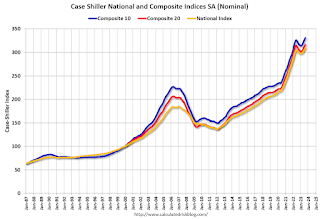
The first graph shows the nominal seasonally adjusted Composite 10, Composite 20 and National indices (the Composite 20 was started in January 2000).
The Composite 10 index is up 1.0% in August (SA) and is at a new all-time high.
The Composite 20 index is up 1.0% (SA) in August and is also at a new all-time high.
The National index is up 0.9% (SA) in August and is also at a new all-time high.

The Composite 10 SA is up 3.0% year-over-year. The Composite 20 SA is up 2.2% year-over-year.
The National index SA is up 2.6% year-over-year.
Annual price changes were close to expectations. I'll have more later.


