by Calculated Risk on 11/02/2023 01:40:00 PM
Thursday, November 02, 2023
Realtor.com Reports Weekly New Listings UP 5.6% YoY; Active Inventory Down 1.0% YoY
Realtor.com has monthly and weekly data on the existing home market. Here is their weekly report: Weekly Housing Trends View — Data Week Ending Oct 28, 2023
• Active inventory declined, with for-sale homes lagging behind year ago levels by 1.0%.
For 19 straight weeks, the number of homes available for sale has registered below that of the previous year.
• New listings–a measure of sellers putting homes up for sale–were up this week, by 5.6% from one year ago.
Since mid-2022, new listings have registered lower than prior year levels, as the mortgage rate lock-in effect freezes homeowners with low-rate existing mortgages in place. This past week, the trend abruptly reversed as new listings during the week outpaced the same week in the previous year by 5.6%. While growth in new listings is a needed step for the market to return to normal, this growth rate reflects a rapid decline last year compared to a more stable newly listed homes pace this year, as we are lapping a period of time last year when new listing activity was unseasonably low due to the said mortgage rate lock-in effect.
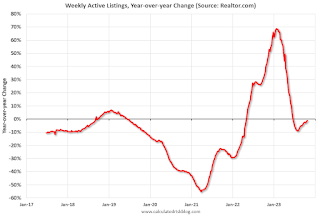
 Here is a graph of the year-over-year change in inventory according to realtor.com.
 Inventory was down 1.0% year-over-year - this was the 19th consecutive week with a YoY decrease following 58 consecutive weeks with a YoY increase in inventory.
The YoY decline in inventory has generally been getting smaller recently and I expect inventory to be up YoY soon - but still historically very low.
New listings really collapsed a year ago, so the YoY comparison for new listings is easier now - and although new listings remain historically very low, new listings are now up YoY.


