 RSS Feed
 by Calculated Risk on 9/09/2024 08:17:00 AM
Monday, September 09, 2024
Housing Sept 9th Weekly Update: Inventory Down 0.1% Week-over-week, Up 38.0% Year-over-year
Altos reports that active single-family inventory was down 0.1% week-over-week. Inventory is now up 42.4% from the February seasonal bottom.
 Click on graph for larger image.
This inventory graph is courtesy of Altos Research.
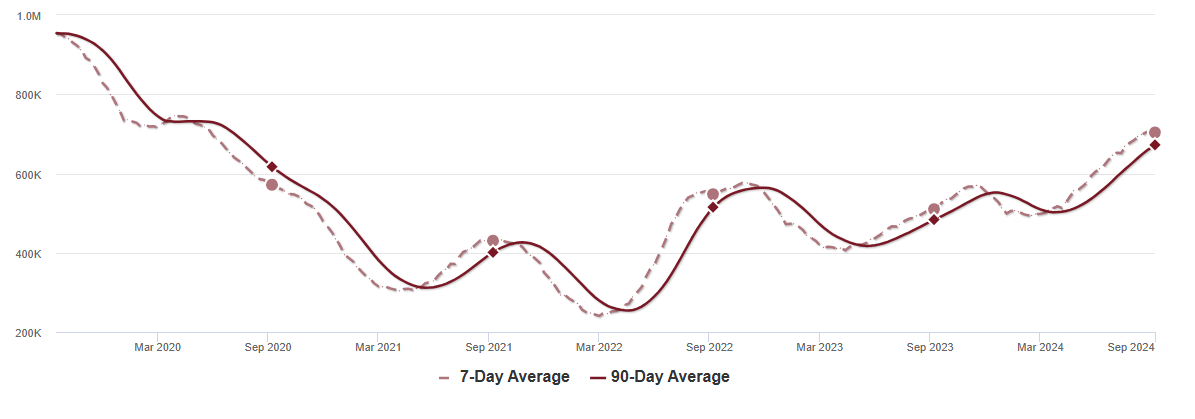
As of September 6th, inventory was at 704 thousand (7-day average), compared to 704 thousand the prior week.
It is possible inventory is at or close to the peak for the year (this would be normal timing pre-pandemic).
The second graph shows the seasonal pattern for active single-family inventory since 2015.

The red line is for 2024. The black line is for 2019.
Inventory was up 38.0% compared to the same week in 2023 (last week it was up 38.2%), and down 25.7% compared to the same week in 2019 (last week it was down 26.6%).
Back in June 2023, inventory was down almost 54% compared to 2019, so the gap to more normal inventory levels is slowly closing.
Mike Simonsen discusses this data regularly on Youtube.


