by Calculated Risk on 4/16/2011 09:15:00 PM
Saturday, April 16, 2011
CoStar: Commercial Real Estate prices increased slightly in February
From CoStar: CoStar Pricing Performance Varies Significantly Between Different Regions and Property Types
• The Composite Index, which is an equal-weighted analysis repeat sale pricing index incorporating both the Investment Grade and General Grade indices and a reflection of the broad overall market, posted a slight increase in property value for the month of February of 0.6%, reflecting the strong monthly increase in the General Grade repeat sale index. The Composite Index is down 7.5% year over year. [this is off 30.5 from the peak in August 2007]
• At the national level, CoStar’s Investment Grade Commercial Repeat-Sale Index is up 6.8% compared with the same period last year, even after four consecutive months of declines, including a very slight 0.3% decline in February. [this is off 34.8% from the peak in June 2007]
• CoStar’s General Grade Index is down 10.9% compared with the same period last year, although this pricing index has trended upward recently, posting two consecutive months of increases, including a strong 0.8% increase from January to February. [this is off 29.0% from the peak in June 2007]
 Click on graph for larger image in new window.
This graph from CoStar shows the indexes for investment grade, general commercial and a composite index. The Investment Grade was down, the other two were up slightly in February.
It is important to remember that there are very few CRE transactions (compared to residential), and that there is a high percentage of distressed sales, so prices are very volatile. Also CoStar is seeing significant variations in pricing performance between different regions and property types. A couple of examples:
• Multifamily pricing in the Northeast at the end of 2010 stood within 4.8% of its peak level according to CoStar’s Northeast Multifamily pricing index.With apartment vacancy rates falling rapidly, and rents rising, it is no surprise that multifamily is the best performing property type.
• At the other end of the spectrum, CoStar’s West Office pricing index remains 43% below its peak-pricing level.
Earlier:
• Summary for Week ending April 15th
• First Look at 2012 Cost-Of-Living Adjustments and Maximum Contribution Base
Thursday, April 14, 2011
Office Vacancy Rates and New Deliveries for three SoCal Cities
by Calculated Risk on 4/14/2011 11:57:00 PM
Voit released their Q1 CRE reports today. These reports are for several cities in the west: Los Angeles, San Diego, Orange County, Las Vegas, and more (these are for several categories of CRE - offices, retail, industrial). There is plenty of detail for those interested in CRE.
The following graphs show vacancy rate vs. new deliveries for offices in Orange County, San Diego and for the Inland Empire.

The first graph is from Voit for Orange County (not labeled).
New deliveries stopped a little earlier in Orange County than in some other areas, possibly because of all the subprime companies going under in 2007.
The fewer deliveries have helped, and the vacancy rate is starting to fall. But look back at the '90s - it took several years of falling vacancy rates before new deliveries started hitting the market. It will probably be a few years again this time too.

For San Diego, new deliveries didn't stop completely, and the vacancy rate has only declined slightly. Still net absorption is positive, but there probably won't be much new construction for a few years.

Once again new deliveries have slowed sharply, but the vacancy rate still increased slightly in Q1.
The good news for employment and GDP is that new office construction in these areas can't fall much further. The bad news for construction employment and GDP is that construction probably won't increase significantly for a few years.
Tuesday, April 05, 2011
When will Office Investment increase?
by Calculated Risk on 4/05/2011 03:27:00 PM
Earlier this morning Reis released their office vacancy rate report for Q1 2011. Reis reported that the vacancy rate declined slightly to 17.5% in Q1 from 17.6% in Q4 2010; the first decline since 2007.
So when will non-residential investment in office structures start to increase? Short answer: Probably not for a couple of years.
 Click on graph for larger image in graph gallery.
This graph shows office investment in real dollars (left axis in blue) seasonally adjusted annual rate (SAAR), and the office vacancy rate from Reis (right axis in red).
The two arrows point at two previous periods when investment picked up as the vacancy rate declined. In the mid-'90s, it isn't clear if we should say investment picked up at the beginning of '95 or '96, but it was when the vacancy rate was around 13% or 14% and falling.
In the mid-'00s, real office investment picked up at the end of 2005 when the vacancy rate had declined to around 13%.
So investment will probably pick up when the office vacancy rate declines to 13% or 14% (from the current 17.5%). Based on the previous two episodes of high vacancy rates, it will probably take about 2 to 3 years until the vacancy rate falls that far.
On the plus side, the recent office investment bubble was nothing like the S&L driven bubble of the '80s or the stock market driven bubble of the late '90s. Also the level of current investment is at a historic low in real terms. And that would suggest the vacancy rate might fall faster this time.
Note: see this graph and this post for investment in offices, malls and hotels as a percent of GDP since 1959.
Unfortunately employment growth will probably remain choppy and sluggish until residential investment picks up (and that will not happen until the excess vacant supply is absorbed). Office space is absorbed as employment increases, and sluggish employment growth suggests it might take longer for the vacancy rate to fall.
So the low level of investment suggests the vacancy rate will fall faster than earlier periods - and sluggish employment growth suggests the vacancy rate will decline slower - so I'd say about two year until investment picks up (maybe more). Also, the decline in the vacancy rate suggests that office investment will stop declining soon - and declining office investment has been a drag on real GDP growth for eleven consecutive quarters.
Thursday, March 24, 2011
Hotels: Occupancy Rate improves in Latest Survey
by Calculated Risk on 3/24/2011 10:43:00 PM
Here is the weekly update on hotels from HotelNewsNow.com: STR: U.S. ADR on the rise
“The industry’s performance seems to be strengthening after Valentine's Day and heading into Spring Break season,” said Steve Hood, VP of research at STR. “Last week was the fifth straight week with ADR increases in the 3% range. It was also the first full week since November with a running 28-day revenue per available room percent change in the double digits.”Note: ADR: Average Daily Rate, RevPAR: Revenue per Available Room.
Overall, the U.S. hotel industry’s occupancy increased 5.1% to 64.6% and its RevPAR finished the week up 9.0% to US$66.01.
 Click on graph for larger image in graph gallery.
This graph shows the seasonal pattern for the hotel occupancy rate.
The 2011 occupancy rate (red) was fairly low in January and February, but appears to be improving recently - and is now closer to the rate in 2008 than in 2010.
Data Source: Smith Travel Research, Courtesy of HotelNewsNow.com
Wednesday, March 23, 2011
AIA: Architecture Billings Index increased slightly in February
by Calculated Risk on 3/23/2011 12:01:00 AM
Note: This index is a leading indicator for new Commercial Real Estate (CRE) investment.
From the American Institute of Architects: Architecture Firm Billings Increase Slightly in February
The Architecture Billings Index (ABI) score of 50.6 for February indicates that very modest growth occurred at architecture firms that month. Although the pace of growth has slowed from the end of 2010, February still marks the fourth consecutive month that the ABI has been 50 or higher; an encouraging sign for a recovery. In addition, inquiries into new projects remain strong at firms.
 Click on graph for larger image in graph gallery.
This graph shows the Architecture Billings Index since 1996. The index showed billings were slightly higher in February (at 50.6).
Note: Nonresidential construction includes commercial and industrial facilities like hotels and office buildings, as well as schools, hospitals and other institutions.
According to the AIA, there is an "approximate nine to twelve month lag time between architecture billings and construction spending" on non-residential construction. So this indicator suggests the drag from CRE investment will end mid-year 2011 or so - but there won't be a strong increase in investment.
Tuesday, March 22, 2011
Moody's: Commercial Real Estate Prices declined 1.2% in January
by Calculated Risk on 3/22/2011 02:08:00 PM
Moody's reported today that the Moody’s/REAL All Property Type Aggregate Index declined 1.2% in January. Note: Moody's CRE price index is a repeat sales index like Case-Shiller - but there are far fewer commercial sales and there are a large percentage of distressed sales - and that can impact prices and make the index very volatile.
Below is a comparison of the Moodys/REAL Commercial Property Price Index (CPPI) and the Case-Shiller composite 20 index. Beware of the "Real" in the title - this index is not inflation adjusted.
 Click on graph for larger image in graph gallery.
CRE prices only go back to December 2000. The Case-Shiller Composite 20 residential index is in blue (with Dec 2000 set to 1.0 to line up the indexes).
According to Moody's, CRE prices are down 4.3% from a year ago and down about 43% from the peak in 2007.
Thursday, February 24, 2011
Hotels: RevPAR up 10.2% compared to same week in 2010
by Calculated Risk on 2/24/2011 10:46:00 PM
Here is the weekly update on hotels from HotelNewsNow.com: San Diego tops ADR, RevPAR weekly increases
Overall, the U.S. hotel industry’s occupancy increased 6.7% to 59.1%, ADR was up 3.3% to US$99.32, and RevPAR finished the week up 10.2% to US$58.72.Note: RevPAR: Revenue per Available Room.
 Click on graph for larger image in graph gallery.
This graph shows the seasonal pattern for the hotel occupancy rate.
The occupancy rate really fell off a cliff in the 2nd half of 2008, and then 2009 was the worst year for the occupancy rate since the Great Depression. The occupancy rate started to improve in the Spring of 2010, and was above the 2008 rates later in the year.
However, so far, 2011 is closer to the weak occupancy rates of 2009 and early 2010 than to the median for 2000 through 2007 - although it does appear occupancy improved last week.
Data Source: Smith Travel Research, Courtesy of HotelNewsNow.com
Earlier today:
• New Home Sales decrease in January
• Home Sales: Distressing Gap
• Fannie, Freddie, FHA combined REO Inventory at Record Level
Wednesday, February 23, 2011
AIA: Architecture Billings Index shows no change in January
by Calculated Risk on 2/23/2011 12:01:00 AM
Note: This index is a leading indicator for new Commercial Real Estate (CRE) investment.
From the American Institute of Architects: Billings at Architecture Firms Hold Steady in January
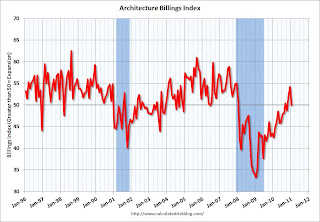
Following a healthy upturn in the fourth quarter, design billings at U.S. architecture firms remained flat in January. The national reading for the AIA’s Architecture Billings Index (ABI) was 50.0, meaning that on average billings in January exactly matched December levels.
 Click on graph for larger image in graph gallery.
This graph shows the Architecture Billings Index since 1996. The index showed billings were at the same level in January as in December (at 50).
Note: Nonresidential construction includes commercial and industrial facilities like hotels and office buildings, as well as schools, hospitals and other institutions.
According to the AIA, there is an "approximate nine to twelve month lag time between architecture billings and construction spending" on non-residential construction. So this indicator suggests the drag from CRE investment will end mid-year 2011 or so.
Thursday, February 17, 2011
Hotel Occupancy Rate: Hotels Struggling in 2011
by Calculated Risk on 2/17/2011 03:14:00 PM
This year has been tough for hotel occupancy, with only a small increase over the very low levels for the same period a year ago. Here is the weekly update on hotels from HotelNewsNow.com: Midscale segment reports weekly decreases
Overall, the U.S. hotel industry’s occupancy increased 1.7% to 54.7%, ADR was up 0.7% to US$97.88, and RevPAR finished the week up 2.4% to US$53.51.The following graph shows the four week moving average of the occupancy rate as a percent of the median occupancy rate from 2000 through 2007.
 Click on graph for larger image in graph gallery.
Note: Since this is the percent of the median from 2000 to 2007, the percent can be greater than 100%.
The down spike in 2001 was due to 9/11. The up spike in late 2005 was hurricane related (Katrina and Rita). The dashed line is the current level.
This shows how deep the slump was in 2009 compared to the period following the 2001 recession. This also shows the occupancy rate improvement has slowed sharply since the beginning of the year (about 90% of the median from 2000 to 2007).
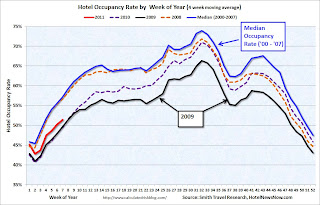 And here is the "spider" graph showing the seasonal pattern for the hotel occupancy rate.
The occupancy rate really fell off a cliff in the 2nd half of 2008, and then 2009 was the worst year for the occupancy rate since the Great Depression. The occupancy rate started to improve in the Spring of 2010, and was above the 2008 rates later in the year.
However, so far, 2011 is closer to the weak occupancy rates of 2009 and early 2010 than to the median for 2000 through 2007.
Blame it on the snow ... but if the occupancy rate doesn't pick up soon, Smith Travel will be reporting year-over-year declines in the occupancy rate again.
Data Source: Smith Travel Research, Courtesy of HotelNewsNow.com
Wednesday, February 09, 2011
CoStar: Commercial Real Estate prices increased slightly in December
by Calculated Risk on 2/09/2011 08:20:00 PM
From CoStar: CoStar Commercial Repeat-Sale Indices, February 2011 Release
• At the national level, CoStar’s Investment Grade Repeat-Sale Index was up nearly 7% for the month of December continuing the see-saw pattern observed with oscillating monthly pricing data, resulting in a slight positive quarter. ... From its peak in July 2007, the Investment Grade pricing index is down 34.1%, with the trough occurring in January 2010 when the Index was down 40%.
• The strong performance of the Investment Grade index was enough to lift the U.S. national Composite Index, which is an equal-weighted repeat sales analysis of all commercial real estate sales, with two thirds of the transaction count contained within the General Index. The Composite Index was up 1.8% for the month, down 5.8% for the quarter and down 6.3% for the year. Overall the Composite Index is down 22% over the past two years.
emphasis added
 Click on graph for larger image in new window.
This graph from CoStar shows the indexes for investment grade, general commercial and a composite index. The general commercial index was down, the other two were up slightly from November.
It is important to remember that there are very few CRE transactions (compared to residential), and that there is a high percentage of distressed sales, so prices are very volatile. On the number of "pairs":
The CCRSI January 2011 report is based on data through the end of December, 2010. In December of 2010 983 pair sales were recorded compared to 656 in the prior month, 610 in October and 690 in September. It is typical to see volume increase at year end. In December of 2009 the pair sales count was 807, so volume on this basis is up 22% from a year earlier. Distress sales as a percent of the total has been increasing in each of the four quarters in 2010 with just over 20% in the 4th quarter with 18.5% for all of 2010. By property type the highest percent of distress in the fourth quarter were for Hospitality at 36%, followed by Multifamily at 24%, office at 21% and industrial and retail both near 19%.So this is based on only 983 transactions.
Monday, January 24, 2011
Moody's: Commercial Real Estate Prices increased 0.6% in November
by Calculated Risk on 1/24/2011 11:37:00 AM
Moody's reported today that the Moody’s/REAL All Property Type Aggregate Index increased 0.6% in November. Note: Moody's CRE price index is a repeat sales index like Case-Shiller - but there are far fewer commercial sales and there are a large percentage of distressed sales - and that can impact prices and make the index very volatile.
Below is a comparison of the Moodys/REAL Commercial Property Price Index (CPPI) and the Case-Shiller composite 20 index. Beware of the "Real" in the title - this index is not inflation adjusted.
 Click on graph for larger image in new window.
CRE prices only go back to December 2000. The Case-Shiller Composite 20 residential index is in blue (with Dec 2000 set to 1.0 to line up the indexes).
According to Moody's, CRE prices are up 2.8% from a year ago and down about 42% from the peak in 2007.
CoStar reported that CRE prices declined in November, and that the commercial market is bifurcated (even trifurcated) with trophy properties doing well, but prices for other properties still declining.
Friday, January 21, 2011
Hotels: RevPAR up 7.6% compared to same week in 2010
by Calculated Risk on 1/21/2011 12:55:00 PM
The last four weeks have been tough for hotel occupancy with only a small increase over the very low levels for the same period a year ago (includes the holidays). Here is the weekly update on hotels from HotelNewsNow.com: STR: US results for week ending 15 Jan.
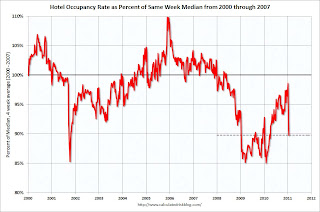
In year-over-year comparisons, occupancy increased 4.5 percent to 49.9 percent, average daily rate was up 3.0 percent to US$97.59, and revenue per available room finished the week up 7.6 percent to US$48.70.The following graph shows the four week moving average of the occupancy rate as a percent of the median occupancy rate from 2000 through 2007.
 Click on graph for larger image in graph gallery.
Note: I've changed this graph. Since this is the percent of the median from 2000 to 2007, the percent can be greater than 100%.
The down spike in 2001 was due to 9/11. The up spike in late 2005 was hurricane related (Katrina and Rita). The dashed line is the current level.
This shows how deep the slump was in 2009 compared to the period following the 2001 recession. This also shows the occupancy rate improvement has slowed sharply over the last 4 weeks (only about 90% of the median from 2000 to 2007).
Data Source: Smith Travel Research, Courtesy of HotelNewsNow.com
Monday, January 17, 2011
Hotels: RevPAR up 7.8% compared to same week in 2010
by Calculated Risk on 1/17/2011 11:49:00 AM
A weekly update on hotels from HotelNewsNow.com: STR: US weekly results for week ending 8 Jan.
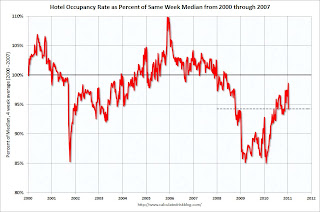
In year-over-year comparisons, occupancy increased 5.7 percent to 42.8 percent, average daily rate was up 2.0 percent to US$93.43, and revenue per available room finished the week up 7.8 percent to US$40.00.The following graph shows the four week moving average of the occupancy rate as a percent of the median occupancy rate from 2000 through 2007.
 Click on graph for larger image in graph gallery.
Note: I've changed this graph. Since this is the percent of the median from 2000 to 2007, the percent can be greater than 100%.
The down spike in 2001 was due to 9/11. The up spike in late 2005 was hurricane related (Katrina and Rita). The dashed line is the current level.
This shows how deep the slump was in 2009 compared to the period following the 2001 recession. This also shows hotels are recovering, but the occupancy rates are still below normal.
RevPAR is up compared to the same week last year, but still down from 2009.
Data Source: Smith Travel Research, Courtesy of HotelNewsNow.com
Sunday, January 16, 2011
CoStar: Commercial Real Estate Prices declined in November
by Calculated Risk on 1/16/2011 02:22:00 PM
Some interesting comments on the trifurcation of the commercial real estate market ...
From CoStar: CoStar Commercial Repeat-Sale Indices
• CoStar’s three national commercial real estate repeat sales indices were down for the month of November despite notable price increases for high profile core transactions in Washington D.C. and New York City
• The Investment Grade index was down 4.1% for the month giving back some, but not all of the 8.1% net gains observed over August, September and October. Notwithstanding November’s decline, the Investment Grade index is still up 7.6% since its cyclical low earlier this year.
Negative national trends contrast with the strong and increasing interest in trophy properties within core markets where prices have continued to climb during 2010. Collectively they show a market that is not just bifurcated but possibly trifurcated, with trophy assets commanding bidding wars, smaller assets languishing, particularly in secondary and tertiary markets; and distressed properties trickling onto the market as banks recycle assets at a relatively measured pace.
emphasis added
 Click on graph for larger image in new window.
This graph from CoStar shows the indexes for investment grade, general commercial and a composite index. All three indexes declined in November.
It is important to remember that there are very few CRE transactions (compared to residential), and that there is a high percentage of distressed sales, so prices are very volatile.
Earlier:
• Summary for Week ending January 15th
• Schedule for Week of January 16th
Wednesday, January 05, 2011
Reis: Apartment Vacancy Rates decline in Q4
by Calculated Risk on 1/05/2011 11:59:00 PM
From the WSJ: For Apartments, a Hot Winter
According to Reis data, the national apartment-vacancy rate was 6.6% in the fourth quarter, down from 7.1% in the third quarter and 8% in the fourth quarter a year ago.Also from Diana Olick at CNBC: One Bright Spark in US Housing — Apartments
...
Effective rent, the amount paid after discounts, rose 0.5% ...
This is a significant decline from the record vacancy rate set a year ago at 8%. This decline fits with the recent survey from the NMHC that showed lower apartment vacancies.
The vacancy rate for large apartment buildings bottomed a year ago, and this indicates the excess housing inventory (that includes both vacant homes and apartments) is being absorbed.
Note: the Reis numbers are for cities. The overall vacancy rate from the Census Bureau was at 10.3% in Q3 2010.
Reis: Strip Mall Vacancy rates steady in Q4
by Calculated Risk on 1/05/2011 12:05:00 PM
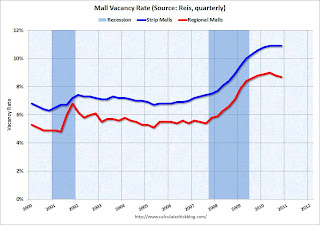 Click on graph for larger image in new window.
From Reuters: Rents at big U.S. malls up, but smaller centers lag
In the fourth quarter, vacancies at U.S. strip malls were flat at 10.9 percent ... Asking rent at strip malls fell 0.1 percent ... at large regional malls ... the vacancy rate fell ... to 8.7 percent ... Asking rents rose for the first time since the third quarter of 2008 ...At regional malls the record vacancy rate was 9.0% in Q2 2010 (Reis started tracking regional malls in 2000). The record vacancy rate for strip malls was in 1990 at 11.1%.
"We appear to be in a meandering sort of direction," said Reis economist Ryan Severino.
It appears both the mall and office vacancy rates have peaked (or are near a peak), but the rates are still very high - and it will take some time for the vacancy rates to come down enough to start building again.
Tuesday, January 04, 2011
Reis: Office Vacancy Rate steady in Q4
by Calculated Risk on 1/04/2011 08:59:00 AM
From Bloomberg: U.S. Office Market Has First Gain in Occupied Space Since 2007, Reis Says
Office buildings added 2.5 million square feet ... of occupied space in the fourth quarter, compared with a loss of 14 million square feet a year earlier, Reis said in its report. It was the first rise in net absorption since the fourth quarter of 2007.
The office vacancy rate was unchanged from the third quarter at 17.6 percent, remaining at the highest level since 1993, as supply also increased. ... “Vacancy has finally appeared to have stabilized,” Ryan Severino, an economist at Reis, said ...
 Click on graph for larger image in new window.
This graph shows the office vacancy rate starting in 1991.
Reis is reporting the vacancy rate was at 17.6% in Q4 2010, the same as in Q3 and up from 17.0% in Q4 2009.
Reis should release the Mall and Apartment vacancy rates over the next few days.
Tuesday, December 21, 2010
AIA: Architecture Billings Index shows expansion in November
by Calculated Risk on 12/21/2010 05:30:00 PM
Note: This index is a leading indicator for new Commercial Real Estate (CRE) investment.
From the American Institute of Architects: Firm Billings Rebound in November
At 52.0, the AIA’s Architecture Billings Index (ABI) recorded a three point gain from the previous month, and reached its strongest level since December 2007. With ABI scores above the 50 level in two of the past three months, the prospects of a sustainable recovery in design activity are enhanced.
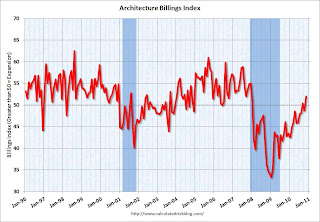 Click on graph for larger image in new window.
This graph shows the Architecture Billings Index since 1996. The index showed expansion in November (above 50) and this is the highest level since December 2007.
Note: Nonresidential construction includes commercial and industrial facilities like hotels and office buildings, as well as schools, hospitals and other institutions.
According to the AIA, there is an "approximate nine to twelve month lag time between architecture billings and construction spending" on non-residential construction. So this indicator suggests the drag from CRE investment will end next summer. This fits with other recent stories about a pickup in design activity.
Monday, December 20, 2010
Moody's: Commercial Real Estate Prices increase in October
by Calculated Risk on 12/20/2010 03:29:00 PM
Moody's reported today that the Moody’s/REAL All Property Type Aggregate Index increased 1.3% in October. Note: Moody's CRE price index is a repeat sales index like Case-Shiller - but there are far fewer commercial sales - and that can impact prices and make the index very volatile.
Below is a comparison of the Moodys/REAL Commercial Property Price Index (CPPI) and the Case-Shiller composite 20 index. Beware of the "Real" in the title - this index is not inflation adjusted.
 Click on graph for larger image in new window.
CRE prices only go back to December 2000. The Case-Shiller Composite 20 residential index is in blue (with Dec 2000 set to 1.0 to line up the indexes).
According to Moody's, CRE prices are about 42% below the peak in 2007.
It is important to remember that the number of transactions is very low and there are a large percentage of distressed sales.
Here is an article from Bloomberg: http://www.bloomberg.com/news/2010-12-20/u-s-commercial-property-rises-for-second-consecutive-month-moody-s-says.html
Thursday, December 16, 2010
Hotels: RevPAR up 11.5% compared to same week in 2009
by Calculated Risk on 12/16/2010 02:29:00 PM
A weekly update on hotels from HotelNewsNow.com: STR: San Francisco tops weekly increases
Overall, the industry’s occupancy increased 8.6% to 52.2%, ADR was up 2.6% to US$98.75, and RevPAR ended the week up 11.5% to US$51.56.The following graph shows the four week moving average for the occupancy rate by week for 2008, 2009 and 2010 (and a median for 2000 through 2007).
 Click on graph for larger image in new window.
Notes: the scale doesn't start at zero to better show the change. The graph shows the 4-week average, not the weekly occupancy rate.
On a 4-week basis, occupancy is up 7.2% compared to last year and 2.6% below the median for 2000 through 2007.
This is the slow season for hotels, and the key will be if business travel picks up early next year.
Note: RevPAR (revenue per available room) was up 2.7% compared to the same week two years ago (in 2008) for the second time this year.
Data Source: Smith Travel Research, Courtesy of HotelNewsNow.com


