by Calculated Risk on 5/24/2006 09:52:00 AM
Wednesday, May 24, 2006
April New Home Sales: 1,198,000
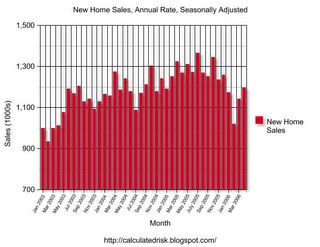
According to the Census Bureau report, New Home Sales in April were at a seasonally adjusted annual rate of 1.198 million. March's sales were revised down to 1.142 million.
Click on Graph for larger image.
NOTE: The graph starts at 700 thousand units per month to better show monthly variation. New Home Sales peaked in July '05 and is now trending down.
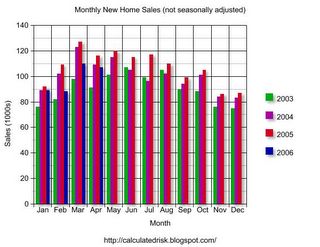
The Not Seasonally Adjusted monthly rate was 107,000 New Homes sold. There were 116,000 New Homes sold in April 2005.
On a year over year basis, April 2006 sales were 7.8% lower than April 2005. Also, April '06 sales were about 2% below April '04.
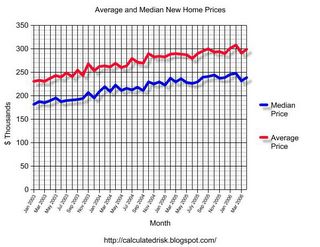
The median and average sales prices were essentially flat. Caution should be used when analyzing monthly price changes since prices are heavily revised.
The median sales price of new houses sold in April 2006 was $238,500; the average sales price was $298,300.
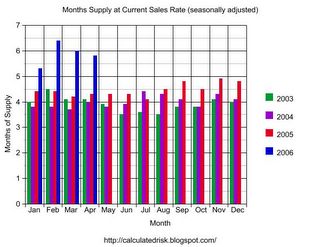
The seasonally adjusted estimate of new houses for sale at the end of April was 565,000. This represents a supply of 5.8 months at the current sales rate.
The 565,000 units of inventory is another all time record for new houses for sale. On a months of supply basis, inventory is significantly above the level of recent years.
Some people might be interested in looking at the charts for March. The only reason April sales are higher than March is because March was revised down from 1.213 million.
I expect April sales to be revised down too. This report shows that the housing market continues to slow down.


