by Calculated Risk on 10/30/2006 12:26:00 AM
Monday, October 30, 2006
Comparing MEW Calculations
Note: This might be boring. For a more interesting piece, the previous post has excerpts (and links) to Krugman's piece today on the housing bubble.
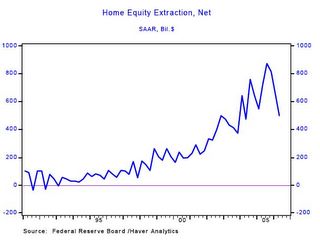
When I excerpted from the recent Merrill Lynch economic forecast, I also presented a graph from Merrill Lynch of Net Mortgage Equity Extraction - what I call mortgage equity withdrawal or MEW. Click on graph for larger image.
Brad Setser asked how the Merrill Lynch estimate of MEW compared to my estimate of MEW. Once again, here is the Merrill Lynch graph based on data from the Federal Reserve and Haver Analytics.
This data is presented seasonally adjusted, at an annual rate (SAAR). This is the graph I presented on MEW. This data is also based on the Federal Reserve Flow of Funds report and the BEA GDP report.
The data is presented as a percent of GDP. Also, this is an estimate of MEW presented on a quarterly basis, NOT seasonally adjusted (NSA). The third graph shows my estimate of MEW at an annualized rate (but still NSA) compared to the Merrill Lynch SA data. It appears my method yields a lower value for MEW, and there are some differences because I haven't SA the data.
The seasonal pattern is Q2 and Q3 are the strongest quarters for equity extraction (about 2/3 of the total annual extraction), followed by Q4. The first quarter is usually the weakest quarter with typically less than 10% of the annual extraction. So SA, Merrill Lynch shows strong MEW in Q1 2006 with a significant decline in Q2. NSA data shows Q1 and Q2 about the same for '06.
As a final note, before the Flow of Funds report is available, the BEA provides an estimate of quarterly mortgage interest paid and the effective mortgage interest rate, based on preliminary data from the Fed. It isn't perfect for MEW because the BEA data includes interest on tenant occupied rental housing, but by dividing interest paid by the effective rate, we can estimate the increase in mortgage debt in Q3 2006. This shows that MEW in Q3 2006 was close, or slightly higher, than the level of Q2 2006.


