by Calculated Risk on 2/14/2007 05:03:00 PM
Wednesday, February 14, 2007
2007 Update
For some time I've felt the first half of 2007 was when we would start to see significant spillover effects from the housing bust into the general economy. I suggested we would see:
1) Several hundred thousand residential construction jobs lost.
Rex Nutting at MarketWatch wrote: Many layoffs coming in housing, economists say
The home-building industry collapsed in 2006, but surprisingly few workers lost their jobs, revised government data show. That could change this year, economists said.
Between December 2005 and December 2006, the number of building permits for new homes plunged 23.5%, while spending on residential construction projects fell by 12.4%. But over that time, employment in residential construction fell by just 1.4% from 3.38 million to 3.34 million. ...
 Click on graph for larger image.
This graph shows residential construction employment vs. completions and starts (Starts are shifted 6 months into the future). Part of my Housing 2007 forecast concerned the loss of 400K to 600K residential construction jobs over the first 6 months of 2007.
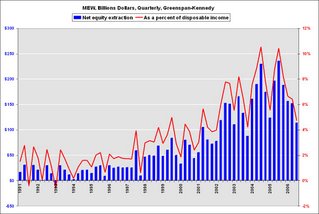
2) A significant decline in Mortgage Equity Withdrawal (MEW), and a negative impact on consumer spending.
 From the WSJ: Homeowners Borrow Less Against Equity in Their Homes, Data Show
 "Homeowners extracted $113.5 billion ... via mortgage refinancing and other means in the third quarter, the lowest since the fourth quarter of 2003, according to new estimates by a Federal Reserve staffer and former chairman Alan Greenspan3) Rising defaults with an impact on lenders.
That amount ... was down from $151.8 billion in the second quarter, and the high of $235.9 billion recorded in the third quarter of last year. The latest figure equals 4.7% of households' after-tax income, compared to 10.4% in the third quarter of 2005."
"We're in the midst of an adjusting market right now, and we won't know until spring or summer if this [foreclosure activity] is ominous or not,"
Marshall Prentice, DataQuick president, Jan 24, 2007
 Click on graph for larger image.
This graph shows Notices of Default (NOD) by year in California since 1992.
2006 had the highest number of NODs since 1998. And it now appears 2007 will see record or near record NODs.
It is now six weeks into 2007, and I think we can agree that there has already been a significant impact on mortgage lenders. We are still waiting for the other two shoes to drop ...


