by Calculated Risk on 4/11/2007 01:51:00 PM
Wednesday, April 11, 2007
The Impact of MEW on PCE
Barry Ritholtz of The Big Picture and Don Luskin are debating the economic outlook at the USNews.com.
Round 1 is here: The Bullish versus Bearish Economic View
Round 2 can be found here: Don’t Worry–Be Happy vs Worry a Lot–Housing Will Hurt the Economy
Note: I no longer use the second chart presented by Barry - it is correct, but it is easy to misinterpret. See my notes here to apparently get even more confused!
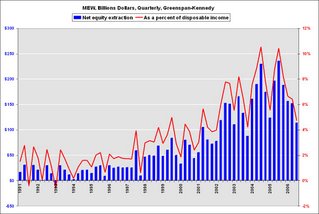
I'd usually stay out of this debate, but since both Barry (with credit - thank you!) and Don (without crediting me) are using my graph, I thought I'd offer some comments. Click on graph for larger image.
This graph shows the Greenspan-Kennedy MEW (Mortgage Equity Withdrawal) calculations (through Q3 2006), both in billions of dollars quarterly (not annual rate), and as a percent of personal disposable income. Note: Q4 2006 has not been released by the Fed yet.
Mr. Luskin took my chart and added the Year-over-year change in PCE and suggests there is no correlation. Here is a better comparison. This is of the trailing four quarters of MEW as a percent of PCE vs. the annual change in nominal PCE.
Some observers might think this chart is sort of a Rorschach inkblot test. They would suggest observers see what they want to see.
In fact the correlation is low over this period, around 0.07. But that is the point that Barry is making. In the earlier periods, MEW wasn't important for PCE growth, but in recent years MEW probably was a very important component of PCE.
I think most economists agree that declining MEW in 2007 will negatively impact consumption. The current debate is on the size of the impact. Greenspan has argued that about 50% of MEW flows to consumption. This may be too high or too low - the percentage is difficult to estimate because other factors also impact consumption.
Round 3 should be available shortly.


