by Calculated Risk on 5/21/2007 05:39:00 PM
Monday, May 21, 2007
MEW Update
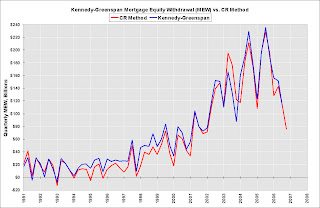
I've been patiently waiting for the Q4 2006 release of the unofficial Kennedy-Greenspan Mortgage Equity Withdrawal (MEW) estimates. I haven't seen the Q4 estimates yet, so I've worked up an approximation for MEW. Click on graph for larger image.
The first graph compares the quarterly Net Equity Extraction for the Kennedy-Greenspan method and the new CR method. Note that the Kennedy-Greenspan data (blue) ends in Q3 2006.
Here is my method to estimate MEW (correlation: 97.9%):
1) Calculate the increase in mortgage debt for the quarter from the Fed's Flow of Funds report, Table B.100, line 32.
2) Subtract 80% of the investment in Single-family structures from the BEA, Underlying Detail Tables, Table 5.4.5BU. Private Fixed Investment in Structures by Type, line 37 The second graph shows the MEW results, both in billions of dollars quarterly (not annual rate), and as a percent of personal disposable income.
In the future, I'll update MEW as soon as the Fed's Flow of Funds report is released (probably early June for Q1 2007).
In the meantime we can use the BEA estimate of mortgage payments in Q1 (and effective interest rate) to calculate MEW (this is a rough approach, I'll have more on this estimate soon). Using the BEA data, MEW will probably rebound to around 6% to 7% 5% of DPI in Q1 - so MEW was probably strong in Q1, and declining MEW didn't significantly impact consumption spending in Q1.


