by Calculated Risk on 6/08/2007 10:59:00 AM
Friday, June 08, 2007
April Trade Deficit, MEW and Interest Rates
The Census Bureau reported today for April 2007:
"in a goods and services deficit of $58.5 billion, $3.9 billion less than the $62.4 billion in March"
 Click on graph for larger image.
The red line is the trade deficit excluding petroleum products. (Blue is the total deficit, and black is the petroleum deficit).
Looking at the trade balance, excluding petroleum products, it appears the deficit has peaked and has been declining since the second half of 2005.
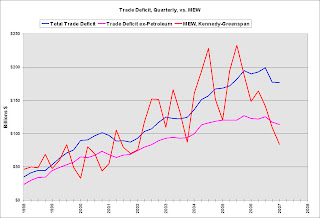
The trade deficit, ex-petroleum, appears to have peaked at about the same time as Mortgage Equity Withdrawal in the U.S.
"Interestingly, the change in U.S. home mortgage debt over the past half-century correlates significantly with our current account deficit. To be sure, correlation is not causation, and there have been many influences on both mortgage debt and the current account."
Alan Greenspan, Feb, 2005
 The second graph shows the quarterly trade deficit, with and without petroleum, and quarterly mortgage equity withdrawal.
Declining MEW is one of the reasons I forecast the trade deficit to decline in '07. And a declining trade deficit also has possible implications for U.S. interest rates; as the trade deficit declines, rates may rise in the U.S. because foreign CBs will have less to invest in the U.S.. This is why I forecast rates to rise in '07.
And rising rates have negative implications for housing and will probably lead to less MEW. This could lead to a vicious cycle for a short time - less MEW leading to a lower trade deficit, followed by rising rates, follow by less MEW, and repeat.


