by Calculated Risk on 6/29/2007 10:36:00 AM
Friday, June 29, 2007
May Construction Spending, Part I
From the Census Bureau: February 2007 Construction Spending at $1,170.8 Billion Annual Rate
The U.S. Census Bureau of the Department of Commerce announced today that construction spending during May 2007 was estimated at a seasonally adjusted annual rate of $1,176.6 billion, 0.9 percent above the revised April estimate of $1,166.0 billion.
...
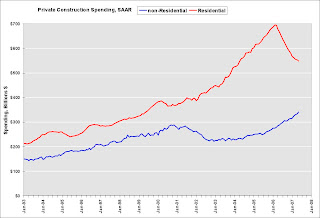
[Private] Residential construction was at a seasonally adjusted annual rate of $549.0 billion in May, 0.8 percent below the revised April estimate of $553.6 billion.
[Private] Nonresidential construction was at a seasonally adjusted annual rate of $343.1 billion in May, 2.7 percent above the revised April estimate of $334.1 billion.
 Click on graph for larger image.
This graph shows private construction spending for residential and non-residential (SAAR in Billions). While private residential spending has declined significantly, spending for private non-residential construction has been strong.
The second graph shows the YoY change for both categories of private construction spending.
 The normal historical pattern is for non-residential construction spending to follow residential construction spending. However, because of the large slump in non-residential construction following the stock market "bust", it is possible there is more pent up demand than usual - and that the non-residential boom will continue for a longer period than normal.
This will probably be one of the keys for the economy going forward: Will nonresidential construction spending follow residential "off the cliff" (the normal historical pattern)? Or will nonresidential spending stay strong. I'll have some comments on this question later today.


