by Calculated Risk on 6/01/2007 09:10:00 AM
Friday, June 01, 2007
May Employment Report
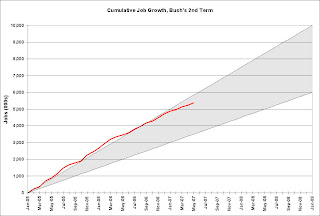
The BLS reports: U.S. nonfarm payrolls rose by 157,000 in May, after a downward revised 80,000 gain in April. The unemployment rate was steady at 4.5% in May.  Click on graph for larger image.
Here is the cumulative nonfarm job growth for Bush's 2nd term. The gray area represents the expected job growth (from 6 million to 10 million jobs over the four year term). Job growth has been solid for the last 2 1/4 years and is near the top of the expected range.
The following two graphs are the areas I've been watching closely: residential construction and retail employment.
Residential construction employment decreased by 1,300 jobs in May, and including downward revisions to previous months, is down 137.9 thousand, or about 4.0%, from the peak in March 2006. This is probably just the beginning of the loss of hundreds of thousands of residential construction jobs over the next year or so.
Note the scale doesn't start from zero: this is to better show the change in employment.
Retail employment lost 4,900 jobs in May. As the graph shows, retail employment has turned positive in recent months. YoY retail employment has also turned positive.
The expected reported job losses in residential construction employment still haven't happened, and any spillover to retail isn't apparent yet. With housing starts off over 30%, it's a puzzle why residential construction employment is only off about 4%. It is possible this puzzle has been solved (see: Residential Construction Employment Conundrum Solved?), but we will not know until the yearly revisions are announced.


