by Calculated Risk on 6/25/2007 12:43:00 PM
Monday, June 25, 2007
More on May Existing Home Sales
For more existing home sales graphs, please see the previous post: May Existing Home Sales
NAR reported that existing home inventories are at record levels today. To put these numbers into perspective, here are the year-end inventory and months of supply numbers, since 1982 (Note: The only data I have is year-end starting in 1982). Click on graph for larger image.
The current inventory of 4.431 million units is an all time record. The "months of supply" metric is now above the level of the previous housing slump in the early '90s, but still below the levels of the housing bust in the early '80s.
The "months of supply" is calculated by dividing the total inventory by the seasonally adjusted annual rate (SAAR) of sales, and multiplying by 12. Currently inventory is 4.431 million, SAAR sales are 5.99 million giving 8.9 months of supply.
Both the numerator and the denominator are moving in the wrong direction. Not only is inventory at record levels, but sales - though falling - are still significantly above the normal range as a percent of owner occupied units (a measure of turnover). See the second graph.  One of the rarely mentioned stories, related to the housing boom, was the increase in turnover of existing homes. This graph shows sales and inventory normalized by the number of owner occupied units.
Note: all data is year-end except 2007. For 2007, the May sales rate and inventory are used. For owner occupied units, Q1 2007 data from the Census Bureau housing survey was used for May 2007.
This graph shows the extraordinary level of existing home sales for the last few years, reaching 9.5% of owner occupied units in 2005. The median level is 6.0% for the last 35 years.
Some of the sales were for investment and second homes, but normalizing by owner occupied units probably provides a good estimate of normal turnover. A decline in sales to 6% of owner occupied units would result in about 4.6 million sales. If sales fall back to the level of 1998 to 2001 (7.3% of total owner occupied units sold) that would be about 5.6 million units in 2007.
Also look at inventory as a percent of owner occupied units; an all time record of 5.9%! Imagine if sales fell back to the median level for the last 35 years; the months of supply would be ONE YEAR.
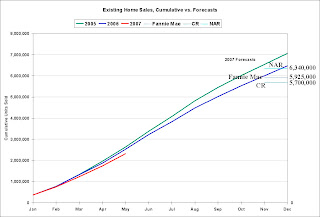
And writing about sales, the followings shows the actual cumulative existing home sales (through May) vs. three annual forecasts for 2007 (NAR's Lereah, Fannie Mae's Berson, and me). My forecast was for sales to be between 5.6 and 5.8 million units (shown as 5.7 million).
NSA sales are 91% of 2006 at this point. If sales maintain that percent of 2006, then total sales will be 5.94 million - about at Fannie Mae's forecast.
To reach the NAR forecast (revised downward on April 11 to 6.34 million units), sales will have to be above 2006 levels for the remainder of the year. Given tighter lending standards, we can probably already say the recent NAR forecast is "no longer operative"!
UPDATE: We do requests (occasionally) at CR. The following graph was requested by BrooklynInDaHouse. This graph shows the ACTUAL annual sales, year end inventory and months of supply, since 1982 (sales since 1969). For 2007, the May inventory and Seasonally Adjusted Annual Rate (SAAR) for sales were used.
Unfortunately I don't have inventory data prior to 1982. Note that in graph 2 above, sales and inventory are normalized by the number of Owner Occupied Units.


