by Calculated Risk on 6/05/2007 04:37:00 PM
Tuesday, June 05, 2007
Wells Fargo: Homebuilding's lull 'unsustainably low'
Jon Lansner at the O.C. Register has an excerpt from Well Fargo's economist Michael Swanson on housing: Homebuilding's lull 'unsustainably low'
In 2005, the market experienced 2.1 million housing starts, which was the highest level since 1972’s 2.4 million starts.This analysis is incorrect.
...
In 1972, US population was 210 million with 66.7 million households, and the average household contained 3.2 people. In 2007, US population is an estimated 302 million with 115.6 million households. That implies that the average number of people per household had fallen to 2.6. 2005’s peak construction doesn’t hold a candle to early rates of construction. In 1972, the market started 11.3 houses per thousand of population versus 2005’s 7 houses. And, the discrepancy in houses started per hundred households is even larger with 1972’s peak of 3.5 houses dropping to 1.8 houses. Adjusted for population and household creation, 2005’s peak wasn’t particularly impressive, and the current bottom is unsustainably low.
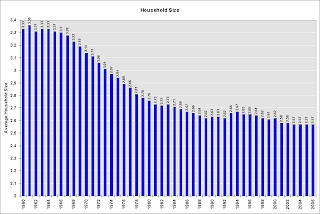
There has been a long term trend towards smaller size households in the U.S. During the '70s, there was a rapid decrease in the size of households, probably because the baby boomers were moving out on their own.
 Click on graph for larger image.
This graph shows household size in the U.S. (Source: Census Bureau). Note that the graph starts at 2 to better show the change.
If the population had been steady during the '70s (no growth), the U.S. would still have needed to add 9 million housing units because of the shift in household sizes. However, since 2000, if the population had stayed steady, the U.S. would have only had to add 0.4 million housing units - since the average household size has barely changed.
So, unless Dr. Swanson is suggesting there will be another significant decrease in household sizes in the near future, his analysis is apples vs. oranges. The analysis should be adjusted for changes in household size, and Dr. Swanson will discover that the recent level of starts was "unsustainable".
Dr. Swanson also picked the peak year for starts; the average in the '70s was 1.75 million units per year compared to 1.83 million since 2000. This is before adjusting for changes in household size. If we subtract 900K (9 million total per decade) per year during the '70s that gives 0.85 million starts per year. If we subtract 70K (400K total for six years) per year from the '00s that gives 1.76 million per year. Those are the numbers Swanson should be comparing to population size.
The population increased 36% (average for '70s vs. average for '00s), but starts more than doubled.
Note: On the reason for the large shift in household size during the '70s, the Census Bureau provides data on the intent of housing starts: New Privately Owned Housing Units Started in the United States, by Intent and Design. Unfortunately the data doesn't start until 1974, but it appears there were significantly larger percentage of "built to rent" units in the '70s - suggesting the Baby Boomers moving explanation might be correct.


