by Calculated Risk on 7/27/2007 09:49:00 AM
Friday, July 27, 2007
GDP and Fixed Investment
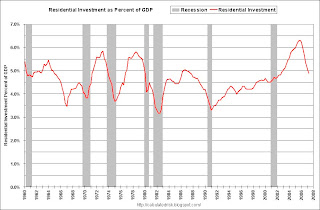
The first graph shows Residential Investment (RI) as a percent of GDP since 1960. Click on graph for larger image
Residential investment, as a percent of GDP, has fallen to 4.88% in Q2 2007. The median for the last 50 years is 4.58%.
Although RI has fallen significantly from the cycle peak in 2005 (6.3% of GDP in Q3 2005), RI as a percent of GDP is still well above all the significant troughs of the last 50 year (all below 4% of GDP). Based on these past declines, RI as a percent of GDP could still decline significantly over the next year or so.
The fundamentals of supply and demand also suggest further significant declines in RI.
Non Residential Structures Investment in non-residential structures continues to be very strong, increasing at a 22% annualized rate in Q2 2007.
The second graph shows the YoY change in Residential Investment (shifted 5 quarters into the future) and investment in Non-residential Structures. In a typical cycle, non-residential investment follows residential investment, with a lag of about 5 quarters. Residential investment has fallen significantly for five straight quarters. So, if this cycle follows the typical pattern, non-residential investment will start declining later this year.
Right now it appears the lag between RI and non-RI will be longer than 5 quarters in this cycle. Although the typical lag is about 5 quarters, the lag can range from 3 to about 8 quarters. The third graph shows the YoY change in nonresidential structure investment vs. loan demand data from the Fed Loan survey. Unfortunately the demand survey data is only available since 1995, but the correlation is clear: falling demand leads lower investment by about a year. The causation is obvious, loans taken out today impact investment over the next couple of years.
This data suggests that nonresidential structure investment is likely to follow the decline in residential investment later this year.
Equipment and Software The final graph shows the typical relationship between residential investment (shifted 3 quarters) and fixed investment in equipment and software. Usually investment in equipment and software follows residential investment by about 3 quarters.
Although the YoY change in real investment in equipment and software is weak, investment picked up in Q2 at a 2.3% annual rate.


