by Calculated Risk on 9/13/2007 06:48:00 PM
Thursday, September 13, 2007
Housing Starts and Demographics
Both the UCLA Anderson Forecast and Goldman Sachs have recently revised down their estimates for housing starts for the next couple of years. UCLA is now forecasting starts falling to 1 million units annually. Goldman Sachs' forecast is for starts to fall to 1.1 million units in Q4 '07 and Q1 '08 (see bottom of this post for Goldman's housing forecast by quarter).
My forecast is for starts to fall to about 1.1 million units.
Two Key Points:
1. If these forecasts are accurate, starts have fallen less than 60% from the recent peak annual rate in 2005 (2.07 million units) to the eventual bottom. We are barely more than half way, in terms of starts, from the peak to the trough!
2. Demographics are NOT currently favorable for housing as compared to the late '60 through early '80s.
Here is a graph of housing starts since 1959 at a Seasonally Adjusted Annual Rate (SAAR) (Source: Census Bureau). Note: Remember starts include homes built for sales, owner built homes, apartments and condominiums. These number can't be compared directly to New Home sales. Click on graph for larger image.
This graph shows that starts have fallen from just over 2 million units per year to an average of 1.45 million (SAAR) over the first 7 months of 2007. Based on the above forecasts there is a second significant decline in starts coming.
Look at those peaks in starts in the '70s and early '80s. This has led some analysts to argue that the recent peak in activity wasn't extraordinary, especially since the U.S. population is growing. This is an inaccurate view. The second graph shows the trend of people per household (and people per total housing units) in the United States since 1950. Before the period shown on this graph there was a long steady down trend in the number of people per household.
Note: the dashed lines indicates estimates based on the decennial Census for 1950 and 1960.
Starting in the late '60s there was a rapid decrease in the number of persons per household until about the late '80. This was primarily due to the "baby boom" generation forming new households en masse.
It was during this period - of rapid decline in persons per household - that the peaks in housing starts occurred. Many of those starts, especially in the '70s, were for apartments. Even if there had been no increase in the U.S. population, the U.S. would have needed approximately 27% more housing units at the end of this period just to accommodate the change in demographics (persons per household).
Now look at the period since 1988, the persons per household has remained flat. The increase in 2002 was due to revisions, and isn't an actual shift in demographics. If the population had remained steady since 1988, the U.S. wouldn't have needed any additional housing units!
Here is a simple formula for housing starts (assuming no excess inventory):
Housing Starts = f(population growth) + f(change in household size) + demolitions.
f(change in household size) was an important component of housing demand in the '70s and early '80s. In recent years, f(change in household size) = zero.
Now for a little good news for housing:
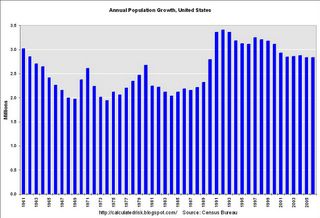
This chart show the annual U.S. population growth according to the Census Bureau. The surge in the early '90s was probably a combination of the Baby Boom echo and perhaps immigration. But the key is that population growth is currently running about 2.85 million people per year.
Back to the formula, this means f(population growth) is larger now than in the '70 and '80s. Unfortunately the improvement in this term is dwarfed by the decline in f(change in household size).
Another piece of good news for housing is that the housing inventory is aging, meaning that the need for demolitions is steadily increasing.
As I noted above, this analysis excludes excess inventory, and unfortunately the current excess is significant (I'll return to this point).
The two key points: there is a second significant decline in starts ahead of us, and demographics are not currently favorable for housing (compared to the '70 and early '80s).


