by Calculated Risk on 11/29/2007 02:34:00 PM
Thursday, November 29, 2007
House Prices and Foreclosures
OFHEO provides a discussion of foreclosures and house prices in the Q3 House Price Index report.
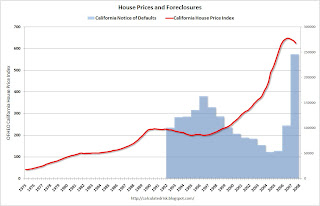
The causal relationship between home prices and foreclosures is two-directional: high foreclosure activity can both cause and be caused by home price declines. Home price declines can cause foreclosures by decreasing the equity homeowners have in their properties. Mortgagors are much more likely to default on their loans if the current value of their property falls below the outstanding loan balance (i.e., their equity is zero or less). Declines in home prices will increase the frequency with which homeowners find themselves with no equity and thus may be motivated to “walk away” from the property and the mortgage.Historically foreclosure activity peaks when prices bottom. The following graph shows this relationship for California.
Home foreclosures contribute to weakening prices by introducing additional supply to the inventory of unsold homes. Compounding this influence is the fact that the sellers of foreclosed homes, frequently creditors, may be strongly averse to holding onto the property for an extended period of time. As a result, they may be willing to sell for lower prices than resident homeowners.
 Click on graph for larger image.
In the '90s, as prices fell in California, foreclosure activity (using Notice of Defaults NODs) increased. Prices bottomed in 1996, as foreclosure activity peaked.
Now imagine what will happen over the next few years as house prices fall. Foreclosure activity is already at record levels (2007 estimated on graph). Yet, as prices fall, foreclosure activity will probably continue to increase - the activity will be literally off the chart!
Back to OFHEO:
The upshot of the interrelatedness of foreclosures and house price changes is that the empirical evidence should reveal sharp differences in measured appreciation for states and cities with higher foreclosure rates. ...

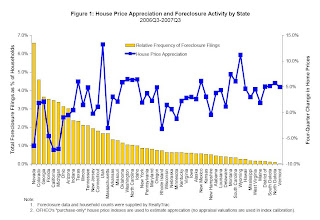
Figure 1 plots recent appreciation rates and foreclosure filings by state since the third quarter of 2006. The bars reflect the relative intensity of foreclosure activity for states, where intensity is defined as the ratio of statewide foreclosure filings to the number of households. The blue squares show house price appreciation between the third quarters of 2006 and 2007. OFHEO’s “purchase-only” price index, which is constructed exclusively with sales price data, is used to estimate price changes.OFEHO's conclusion on house prices and foreclosure:
The graph clearly depicts the negative correlation over the latest year. With few exceptions, states with the lowest appreciation (i.e., greatest depreciation) tended to have the most foreclosure filings. For instance, Nevada had by far the greatest relative foreclosure activity and, at the same time, showed the third largest price decline. By contrast, states with relatively few foreclosure filings, including the Dakotas and Vermont, had relatively strong price growth of between 5 and 6 percent.
In conclusion, it should be recognized that house prices are very hard to track in housing market downturns. Empirical evidence has consistently shown that homeowners are hesitant to sell their homes for losses, often leaving their homes on the market for long periods awaiting the “right” price. Price declines may appear muted, as inventories of for-sale properties grow sharply and the properties that do sell may not fully reflect price declines that have occurred. In this environment, if the inventory of unsold properties is relatively large in high-foreclosure areas, then it may take some time for the association between foreclosures and price trends to reveal itself within cities. The best empirical estimates will only become available after the market normalizes and excess inventory has been sold.Translation: There are large price declines coming.


