by Calculated Risk on 11/20/2007 12:08:00 PM
Tuesday, November 20, 2007
Housing Starts for Single Unit Structures
To add to my earlier post on housing starts, the following graphs are for single unit structures. Click on graph for larger image.
This graph shows permits, starts and completions for single unit structures.
Starts and permits are shifted six months into the future.
Completions will fall significantly over the next 6 months, probably to under 900K at a seasonally adjusted annual rate (SAAR).
As a reminder, you can't compare total starts (or even single unit starts) directly to new home sales. Single unit starts include homes being built by owner that aren't included in the new home sales statistics from the Census Bureau.
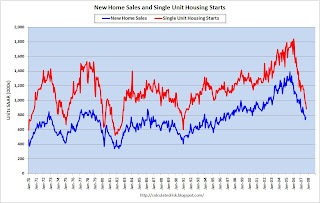
In addition, total starts includes apartments and multi-story condominiums that aren't included in new home sales. The second graph shows new home sales vs. single unit starts since 1970.
Hopefully this makes it clear that new home sales have always been less than single unit structure starts - so people shouldn't expect single unit starts to fall below the level of new home sales. I'll have a new forecast for starts and sales at the end of the year.


