by Calculated Risk on 12/14/2007 03:51:00 PM
Friday, December 14, 2007
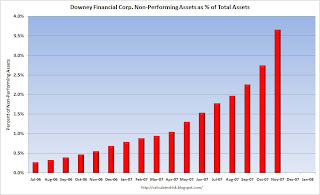
Downey Financial Non-Performing Assets
From the Downey Financial 8-K released today. (hat tip Credit Bubble Stocks and others)
 | Click on graph for larger image. This would be a nice looking chart, except those are the percent non-performing assets by month. Yes, by month! |
BTW, Herb Greenberg provides this quote from an unidentified source: Extrapolating Downey to WaMu, others
DSL was supposed to be the best underwriter. That’s why I owned it at one point. They were the lowest loan-to-value lender, which is interesting considering the data we are seeing now. The problem is that lenders did a horrible job tracking if there was a second lien behind them. Borrowers have so much leverage (first lien + second) and house prices are falling so fast, that they are just deciding to walk away from the home. This is something the Paulsen plan does not address. It’s not a question of being able to make the next payment…it’s looking at the value of your home and thinking ‘wow I am going to be under water for a long time ...


