by Calculated Risk on 12/31/2007 08:54:00 PM
Monday, December 31, 2007
Housing Summary
| What is that pig? It's from Tanta's Excel Art. A Mortgage Pig™ exclusive. Raindrops Keep Falling on My Pig Warning: this is a large (2 MB) Excel File. And yes, the Mortgage Pig™ is wearing lipstick. |
Happy New Year to All!
The following are some excerpts (with graphs) from a few housing posts in December. Follow the link for the entire post.
From Homeowners With Negative Equity
The following graph shows the number of homeowners with no or negative equity, using the most recent First American data, with several different price declines.
 Click on graph for larger image.
At the end of 2006, there were approximately 3.5 million U.S. homeowners with no or negative equity. (approximately 7% of the 51 million household with mortgages).
By the end of 2007, the number will have risen to about 5.6 million.
If prices decline an additional 10% in 2008, the number of homeowners with no equity will rise to 10.7 million.
The last two categories are based on a 20%, and 30%, peak to trough declines.
From: Home Builders and Homeownership Rates
From 1995 to 2005, the U.S. homeownership rate climbed from 64% to 69%, or about 0.5% per year.
 The graph shows the homeownership rate since 1965. Note the scale starts at 60% to better show the recent change.
The reasons for the change in homeownership rate will be discussed [see here], but here are two key points: 1) The change in the homeownership rate added about half a million new homeowners per year, as compared to a steady homeownership rate, 2) the rate (red arrow is trend) appears to be heading down.
From: MBA Mortgage Delinquency Graph
 Here is a graph of the MBA mortgage delinquency rate since 1979.
This is the overall delinquency rate, and it is at the highest rates since 1986. As noted earlier this morning, delinquencies are getting worse in every category - including prime fixed rate mortgages - and getting worse at a faster rate in every category.
NOTE on 12/31/2007: See: Defaults on Insured Mortgages Reach Record
From: Housing Inventory and Rental Units
 Renting is a substitute for owning, and to understand the current excess housing inventory, we also need to consider rental units.
This graph shows the number of occupied (blue) and vacant (red) rental units in the U.S. (all data from the Census Bureau).
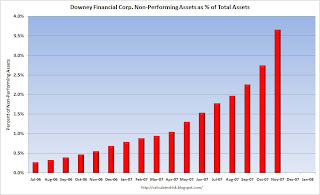
From: Downey Financial Non-Performing Assets
 From the Downey Financial 8-K released on Dec 14th.
This would be a nice looking chart, except those are the percent non-performing assets by month.
From: NAHB: Builder Confidence Unchanged at Record Low
 The NAHB reports that builder confidence was unchanged at a record low 19 in December.
NAHB: Builder Confidence Remains Unchanged For Third Consecutive Month
Builder confidence in the market for new single-family homes remained unchanged for a third consecutive month in December as problems in the mortgage market and excess inventory issues continued, according to the latest NAHB/Wells Fargo Housing Market Index (HMI), released today. The HMI held even at 19 this month, its lowest reading since the series began in January 1985.
From: Single Family Starts Fall to Lowest Level Since April 1991
 Here is a long term graph of starts and completions. Completions follow starts by about 6 to 7 months.
Look at what is about to happen to completions: Completions were at a 1,344 million rate in November, but are about to follow starts to below the 1.2 million level. I'd expect completions to fall rapidly over the next few months, impacting residential construction employment.
From: November New Home Sales
According to the Census Bureau report, New Home Sales in November were at a seasonally adjusted annual rate of 647 thousand. Sales for October were revised down to 711 thousand, from 728 thousand. Numbers for August and September were also revised down.
From: More on New Home Sales
 This graph shows New Home Sales vs. Recession for the last 35 years. New Home sales were falling prior to every recession, with the exception of the business investment led recession of 2001.
 This is what we call Cliff Diving!
And this shows why so many economists are concerned about a possible consumer led recession - possibly starting right now.
From: November Existing Home Sales
 The graph shows the Not Seasonally Adjusted (NSA) sales per month for the last 3 years. Note that on an NSA basis, November sales were slightly below October.
The impact of the credit crunch is obvious as sales in September, October and November declined sharply from earlier in the year.
For existing homes, sales are reported at the close of escrow. So November sales were for contracts signed in September and October.
From: More on November Existing Home Sales
 Click on graph for larger image.
 This graph shows the seasonally adjusted annual rate of reported new and existing home sales since 1994. Since sales peaked in the summer of 2005, both new and existing home sales have fallen sharply.
Ignoring the occasional month to month increases, it is clear that sales of both new and existing homes are in free fall.
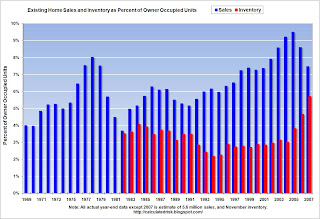
 The second graph shows the annual sales and year end inventory since 1982 (sales since 1969), normalized by the number of owner occupied units. This shows the annual variability in the turnover of existing homes, with a median of 6% of owner occupied units selling per year.
Currently 6% of owner occupied units would be about 4.6 million existing home sales per year. This indicates that the turnover of existing homes - November sales were at a 5.0 million Seasonally Adjusted Annual Rate (SAAR) - is still above the historical median.
This suggests sales will fall much further in 2008.
Happy New Year to All! Best Wishes from CR and Tanta.


