by Calculated Risk on 12/31/2007 12:52:00 PM
Monday, December 31, 2007
More on November Existing Home Sales
For more existing home sales graphs, please see the earlier post: November Existing Home Sales
Occasionally during the housing bust, we have seen months with flat or even rising sales compared to the previous month. This brings out the bottom callers. As an example, from NAR today:
Lawrence Yun, NAR chief economist, said the market appears to be stabilizing. “Near term, existing-home sales should continue to hover in a narrow range, just as they have since September, and that’s good news because it’ll be a further sign that the housing market is stabilizing.”
 Click on graph for larger image.
 This graph shows the seasonally adjusted annual rate of reported new and existing home sales since 1994. Since sales peaked in the summer of 2005, both new and existing home sales have fallen sharply.
Ignoring the occasional month to month increases, it is clear that sales of both new and existing homes are in free fall.
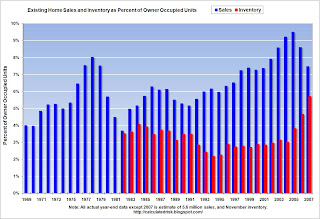
 The second graph shows the annual sales and year end inventory since 1982 (sales since 1969), normalized by the number of owner occupied units. This shows the annual variability in the turnover of existing homes, with a median of 6% of owner occupied units selling per year.
Currently 6% of owner occupied units would be about 4.6 million existing home sales per year. This indicates that the turnover of existing homes - November sales were at a 5.0 million Seasonally Adjusted Annual Rate (SAAR) - is still above the historical median.
This suggests sales will fall much further in 2008.
On inventory: the normal seasonal pattern is for inventory of existing homes to peak in the summer, remain fairly flat through the Fall, and then decline significantly (usually around 15%) in December. Many potential home sellers take their homes off the market during the holidays.
Then usually inventory starts increasing again in the new year. If inventory follows the normal pattern, we will probably see a decline to 3.7 million units or so in December (from 4.273 million units in November). This will bring out even more bottom callers, but it is just the normal seasonal pattern.


