by Calculated Risk on 1/15/2008 09:36:00 AM
Tuesday, January 15, 2008
From the Citi Conference Call
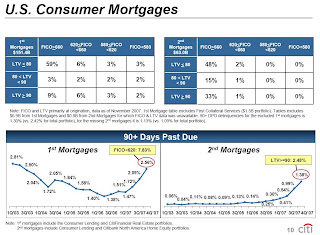
Here are some excerpts from the Citi conference call (hat tip Brian), and a couple of graphs from the Citi presentation. emphasis added
Re: charges to consumer credit portfolio:
Consumer lending net credit losses were higher by $396 million over last year, primarily driven by losses in the consumer mortgage portfolio. In US cards, net credit losses were up by $156 million, reflecting higher write-offs, lower recoveries and higher average yield balances. While delinquency levels remain relatively stable, the increase in write-offs reflect higher bankruptcy filings and the impact of customers that are delinquent in advancing to write-offs at a higher rate.
Within our bank cards portfolio, approximately two-thirds of the losses occurred in five states -- California , Florida , Illinois , Arizona and Michigan . And the loss rates on customers with mortgages in those states increased by fourfold versus the loss rates in the rest of the country .... Loss rates in the branch-originated mortgage business remained relatively stable, where face-to-face interaction with customers and long-standing relationships have historically resulted in lower losses. The CitiFinancial real estate mortgage portfolio, for example, is comprised primarily of full documentation, fixed-rate loans with low loan to values.Consumer reserve build:
Second, the loan-loss reserve build of $3.8 billion was primarily driven by the US consumer reserve build of $3.3 billion. Approximately 73% or $2.4 billion of the US consumer build was in the consumer lending group, reflecting continued weakness in the mortgage portfolio and a higher expectation for losses in the auto portfolio. The auto portfolio is primarily subprime with loans sourced directly through dealers. I will discuss the mortgage portfolio in more detail in just a minute. Approximately 15% of the US consumer build or $493 million was in US cards. While US cards delinquencies remain relatively stable, the build reflects recently observed trends, which point to an expectation of higher losses in the near term. As I mentioned, the rate at which delinquent customers advance to write-offs has increased. This is especially true in certain geographic areas where the impact of events in the housing market has been greatest driving higher loss rates. Bankruptcy filings have increased from historically low levels. These trends and other portfolio indicators led to a build in reserves for US cards in the quarter. …..This increase in net credit losses included $[535] million related to loans with subprime mortgage collateral included in the $18.1 billion figure that I previously mentioned. Credit costs also include a $284 million net charge to increase loan-loss reserves reflecting a slight weakening in overall portfolio credit quality. They also include loan-loss reserves set aside for specific counterparties, including $169 million related to our direct subprime exposures, which is also included in the $18.1 billion figure.Delinquency specifics in mortgages:

On slide 10, the two grides, which show the FICO and LTV distribution for the US consumer mortgage portfolio, are listed. The two graphs at the bottom show the 90 plus day delinquencies in each of the first and second mortgage portfolios. In the grids on the top half of the slide, there are two segments which have demonstrated the greatest weaknesses. In first mortgages, we are experiencing higher losses from the loans which have FICO scores less than 620. This comprises roughly 15% or $23 billion of the first mortgage portfolio. In second mortgages, we are experiencing higher losses from loans with origination loan to value that are greater or equal to 90%, which comprise 34% or $20 billion of the second mortgage portfolio. We consider these two segments the higher risk segments of the portfolio. The bottom graph shows that delinquencies have increased substantially, particularly since the beginning of September. The first mortgage delinquency trend shows that current delinquency levels are almost at their early 2003 peak. A further breakout of the below 620 segment in the yellow box indicates that delinquencies in this segment are three times higher than the overall first mortgage portfolio. By contrast, delinquency rates in our second mortgage portfolio are at historically high levels, particularly in the 90% LTV segment -- 90% and higher LTV segment as shown in the yellow box. This segment has a delinquency rate twice as high as the rate for the overall second mortgage portfolio. In general, first mortgages have higher delinquencies than second mortgages. This is driven by the fact that first mortgages include government guaranteed loans such as those to low and middle income families, which have sharply higher delinquencies due to the guarantee future. There is no equivalent product in the second mortgage portfolio. On the other hand, second mortgages are much more likely to go directly from delinquency to charge-off without going into foreclosure, which explains why the loss deterioration in second mortgages has been more significant than for first mortgages.


