by Calculated Risk on 1/30/2008 10:15:00 AM
Wednesday, January 30, 2008
Non-Residential Investment: The Key?
Residential investment, as a percent of GDP, fell to 4.16% in Q4 2007, and is now below the median of the last 50 years (about 4.56%). Click on graph for larger image
This graph shows Residential Investment (RI) as a percent of GDP since 1960. Based on previous downturns, RI as a percent of GDP will probably bottom in the 3% to 4% range (probably below 3.5% because of the current huge excess supply of housing units).
Simply extrapolating out the current trajectory, RI as a percent of GDP would then bottom in the 2nd half of 2008. Of course, given the magnitude of the boom, RI as a percent of GDP could fall below 3% and not bottom until sometime in 2009.
But we all know housing is getting crushed.
The good economic news in the Q4 GDP report was that non-residential investment was still positive. Investment in non-residential structures increased at a very robust 15.8% annualized real rate. And investment in equipment and software increased at a more modest 3.8% annualized real rate. This non-residential investment is probably the key (along with consumer spending) on how weak the economy will be in 2008.
This following graphs compare residential investment with both of the components of non-residential investment: structures, and equipment and software.
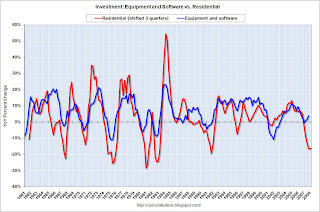
Important Note: On both graphs, residential investment is shifted into the future. Historically investment in non-residential structures follows residential investment by about 5 quarters, and investment in equipment and software follows residential investment by about 3 quarters. For more on these lags, see: Investment Lags.
The second graph shows the YoY change in Residential Investment (shifted 3 quarters into the future) and investment in equipment and software. The normal pattern would be for investment in equipment and software to have turned negative.
Instead investment in equipment and software is still positive.
The third graph shows the YoY change in Residential Investment (shifted 5 quarters into the future) and investment in Non-residential Structures. The normal pattern would be for investment in non-residential structures to turn negative now.
Once again, investment in non-residential structures was still strong in Q4. It is possible that the big investment slump in the early '00s has left many markets with too little supply of commercial and office buildings (and other non-residential structures). If true, then investment in non-residential structures decoupled (at least for a short period) from the typical pattern.
However, there is growing evidence that investment in non-residential structures is now slumping. We will know more when the Fed releases the January Senior Loan Officer Opinion Survey on Bank Lending Practices.
For equipment and software, I think we are still in a technology fueled productivity boom, so it is possible that investment in software and equipment will stay somewhat positive, and not follow residential investment. This is what happened in the '90s (second graph); residential investment slumped somewhat, but investment in equipment and software stayed strong.
Of course, if non-residential investment falters, the U.S. will almost certainly be in a recession.


