by Calculated Risk on 3/07/2008 04:25:00 PM
Friday, March 07, 2008
Construction Employment
One of the mysteries in 2007 was why BLS reported residential construction employment didn't decline as much as expected based on housing starts and completions.
The first graph shows residential construction employment vs. real residential investment (minus broker's commissions). Click on graph for larger image.
This shows the mystery in residential construction employment. Even though Residential Investment fell sharply, residential construction employment is only down 407.1 thousand, or about 11.8%, from the peak in February 2006.
There have been many explanations for this divergence, but part of the reason is that many construction employees shifted to commercial work, without being re categorized as non-residential employees. The second graph shows non-residential construction employment vs. real non-residential investment.
Even though investment surged through the end of 2007, reported employment lagged behind and even declined slightly in 2007. This was most likely because employees shifting to commercial construction were still being reported to the BLS as residential construction employees.
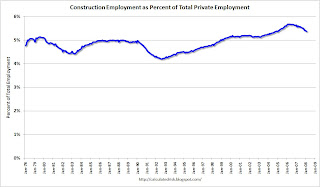
This is important in 2008 because investment in non-residential structures appears to be slowing sharply. The third graph shows total private construction employment as a percent of total private employment since 1978.
Currently construction is about 5.4% of total employment, off the recent highs (5.7%), but well above the cycle lows in '92 (4.2%) and '82 (4.4%). A decline to 4.4% over the next year or two would mean the loss of approximately 1.3 million construction jobs.
This will probably be the key area of job losses in 2008.


