by Calculated Risk on 5/23/2008 10:07:00 AM
Friday, May 23, 2008
April Existing Home Sales
Update: Graphs added.
Update2: Here is the NAR press release.
From MarketWatch: Unsold houses rise to 23-year high in April
The U.S. housing market weakened further in April, with a flood of homes coming on the market even as sales and prices declined, the National Association of Realtors reported Friday.
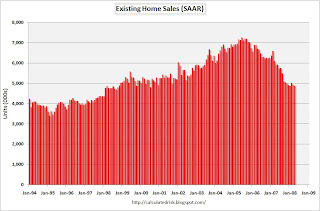
Resales of U.S. houses and condos dropped 1% to a seasonally adjusted annualized rate of 4.89 million from 4.94 million in March.
...
Resales have sunk 17.5% in the past year and are down 33% from the peak in 2005.
...
The inventory of unsold homes jumped 10.5% to 4.55 million, an "uncomfortably high" level, said Lawrence Yun, chief economist for the real estate trade group.
Inventories represented an 11.2 month supply at the April sales pace ...
 Click on graph for larger image.
 The first graph shows existing home sales, on a Seasonally Adjusted Annual Rate (SAAR) basis since 1994.
Sales in April 2008 (4.89 million SAAR) were the weakest April since 1998 (4.77 million SAAR).
 The second graph shows nationwide inventory for existing homes. According to NAR, inventory increased to 4.55 million homes for sale in April.
 The typical pattern is for inventory to decline in December, and then to slowly rebound in January and February, and really start to increase in the Spring.
I'll have more on inventory later today.

The third graph shows the 'months of supply' metric for the last six years.
Months of supply increased sharply to 11.2 months.
This follows the highest year end months of supply since 1982 (the all time record of 11.5 months of supply). Inventory is the story in this report.
More later (the NAR website has problems this morning).


