by Calculated Risk on 5/07/2008 06:27:00 PM
Wednesday, May 07, 2008
More on Home Improvement Investment
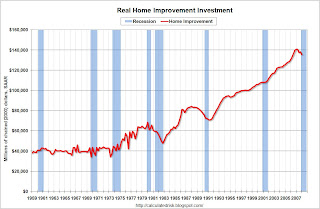
Last week I presented a chart of home improvement investment in real terms. I argued that home improvement spending could fall 15% to 20% in real terms based on previous home improvement slumps.
Here is the chart: Click on graph for larger image.
The BEA reports that real spending on home improvement fell 2% in Q1 2008 (from Q4 2007), and has fallen about 4% in real terms from the peak. This is probably just the beginning of the home improvement slump; if this housing bust is similar to the early '80s or '90s, real home improvement investment will slump 15% to 20%.
Note: This graph shows real home improvement investment (2000 dollars) since 1959. Recessions are in light blue with the current recession "probable". (source: BEA) Here is a 2nd graph in nominal terms comparing residential investment in single family structures (left scale), with investment in home improvement (right scale).
This graph shows how sharp the decline in single family structure investment has been - and how little impact (so far) the housing bust has had on home improvement spending. I don't expect the improvement investment slump to be anywhere near as severe as the single family structure collapse, but this does show there is potentially a significant downside.


