by Calculated Risk on 5/20/2008 12:00:00 PM
Tuesday, May 20, 2008
Philly Fed State Coincident Indicators for April
From the Philadelphia Fed:
The Federal Reserve Bank of Philadelphia produces a monthly coincident index for each of the 50 states. The indexes are released a few days after the Bureau of Labor Statistics (BLS) releases the employment data for the states.Here is the release for April:
The indexes increased in 26 states for the month, decreased in 16, and were unchanged in the remaining eight (a one month diffusion index of 20). For the past three months, the indexes increased in 25 states, decreased in 21, and were unchanged in the other four (a three month diffusion index of eight).
 Click on graph for larger image.
This is a graph of the monthly Philly Fed data of the number of states with increasing activity.
I've added the current probable recession. About half of the U.S. was in recession in April based on this indicator.
Note: the Philly Fed calls some states unchanged with minor changes. The press release says there were 26 states with increasing activity, but including small changes, there were 28 (as graphed).

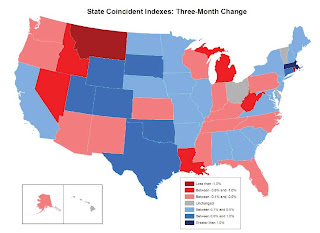
This map is from the Philly Fed report for April, and shows the Three Month change for all 50 states. If the economy is in recession, this map should turn very red over the next few months.
California is definitely in recession by most measures, but the Philly Fed Three Month change shows the state economy is still growing slightly. This is probably true for other states too, and I expect the map to turn more and more red in the coming months.
 For comparison to April, here is the December 2007 map (bottom).
Clearly there is more red in the April (top) map as the recession spreads.


