by Calculated Risk on 6/12/2008 01:23:00 PM
Thursday, June 12, 2008
30 Year Mortgage Rates vs. Ten Year Treasury Yield
Freddie Mac reported today that 30 year mortgage rates jumped to 6.32% last week, up from 6.09% the prior week.
Housing Wire has the story: Fixed Mortgage Rates Hit Eight-Month High as Inflation Concerns Mount
The following is a comparison between the 30 year mortgage rate and the ten year treasury yield. Usually mortgage rates follow the shorter duration Ten Year treasury yield (with a spread), because most homeowners either sell or refinance before 10 years. The period that a homeowner holds a mortgage does vary over time and that does impact the spread between the 30 year rate and the ten year treasury - so it's not a perfect relationship, but it is pretty close.
The yield on the Ten Year treasury jumped to 4.215% today; up sharply from early March when the yield was 3.328%. What does this mean for 30 year mortgage rates?
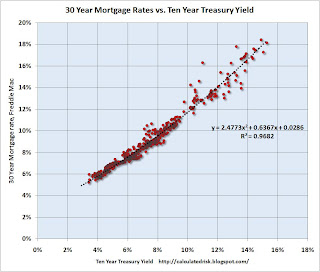
The following scatter graph shows the relationship since 1971.  Click on graph for larger image in new window.
The ten year treasury yield is on the x-axis. The 30 year mortgage rate (from Freddie Mac) is plotted on the Y-axis. Note: this is based on monthly data.
The best fit 2nd order polynominal is plotted on the graph.
Y = 2.4773 * X2 + 0.6373 * X + 0.0286
With the Ten Year yield at 0.042, this equation yields a 30 year fixed mortgage rate of 6.0%, below the average rate of 6.32% reported by Freddie Mac today.
There are probably three reasons the mortgage rate is somewhat above the normal spread:
Whatever the reason, mortgage rates are increasing and that will probably negatively impact sales.


