by Calculated Risk on 6/24/2008 05:32:00 PM
Tuesday, June 24, 2008
Case-Shiller: Tiered Home Price Indices
Here is a look at the Case-Shiller data by price tiers for two cities. See this spread sheet from S&P for tiered pricing for all 20 cities in the Composite 20 index. (note: this is an S&P excel spread sheet, not mine.). Click on graph for larger image in new window.
The first graph shows the real Case-Shiller prices for homes in Los Angeles.
The low price range is less than $408,960 (current dollars). Prices in this range have fallen 37.9% from the peak in real terms.
The mid-range is $408,960 to $617,001. Prices have fallen 32.5% in real terms.
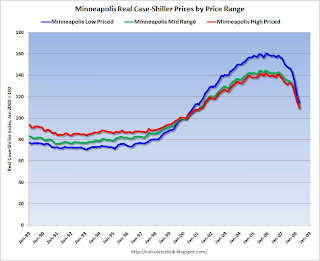
The high price range is above $617,001. Prices have fallen 24.1% in real terms. The second graphs show the real Case-Shiller prices for homes in Minneapolis.
The low price range is less than $173,578 (current dollars). Prices in this range have fallen 28.8% from the peak in real terms.
The mid-range is $173,578 to $247,371. Prices have fallen 23.1% in real terms.
The high price range is above $247,371. Prices have fallen 23.2% in real terms.
In both of these cities, the low end areas saw the most appreciation, and have seen the fastest price declines.
In a number of previous housing busts, real prices declined for 5 to 7 years before finally hitting bottom. If this bust follows that pattern, we will continue to see real price declines for several more years - but if that happens, the rate of decline will probably slow (imagine somewhat of a bell curve on those graphs).
However, with the record foreclosure activity, prices might adjust quicker than normal (lenders are less prone to sticky prices than ordinary homeowners).


