by Calculated Risk on 6/25/2008 10:00:00 AM
Wednesday, June 25, 2008
May New Home Sales: 512K Annual Rate
According to the Census Bureau report, New Home Sales in May were at a seasonally adjusted annual rate of 512 thousand. Sales for April were revised down slightly to 525 thousand (from 526 thousand). Click on graph for larger image in new window.
The first graph shows monthly new home sales (NSA - Not Seasonally Adjusted).
Notice the Red columns for 2008. This is the lowest sales for May since the recession of '91.
As the graph indicates, the spring selling season has never really started. The second graph shows New Home Sales vs. recessions for the last 45 years. New Home sales have fallen off a cliff.
Sales of new one-family houses in May 2008 were at a seasonally adjusted annual rate of 512,000, according to estimates released jointly today by the U.S. Census Bureau and the Department of Housing and Urban Development. This is 2.5 percent below the revised April rate of 525,000 and is 40.3 percent below the May 2007 estimate of 857,000.And one more long term graph - this one for New Home Months of Supply.
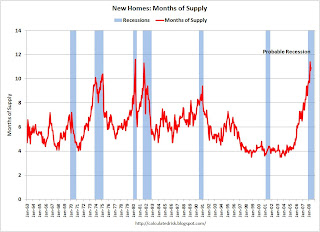
 "Months of supply" is at 10.9 months. Note that this doesn't include cancellations, but that was true for the earlier periods too.
The all time high for Months of Supply was 11.6 months in April 1980.
Once again, the current recession is "probable" and hasn't been declared by NBER.
And on inventory:

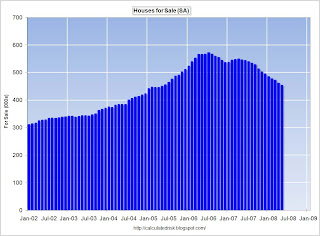
The seasonally adjusted estimate of new houses for sale at the end of May was 453,000. This represents a supply of 10.9 months at the current sales rate.Inventory numbers from the Census Bureau do not include cancellations - and cancellations are near record levels. Actual New Home inventories are probably much higher than reported - my estimate is just under 100K higher.
Still, the 453,000 units of inventory is below the levels of the last year, and it appears that even including cancellations, inventory is now falling.
This is another very weak report for New Home sales and I'll have more later.


