by Calculated Risk on 6/02/2008 11:18:00 AM
Monday, June 02, 2008
Price Distribution of Distressed Homes
Update: for Minneapolis, see Minneapolis: Price Distribution of Distressed Homes
Jon Lansner at the O.C. Register writes: Distressed homes 63% of O.C.’s cheaper supply
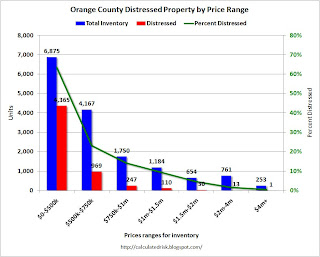
As a percent of all listed homes for sale, distressed properties were 38.7% of the market last week vs. 36.7% two weeks earlier ...It appears distressed inventory is continuing to increase in Orange County similar to the national trend (see the WSJ: Number of Foreclosed Homes Keeps Rising). Note: distressed sales include short sales and REOs.
What is interesting is the numbers are broken down by price range. Here is a graph showing the numbers from Lansner:
 Click on graph for larger image in new window.
Not surprisingly, there are many more distressed homes for sale at the low end; over 70% of inventory is distressed in some of the poorer areas of Orange County (like Santa Ana). Although the lowest category for the graph is less than $500K, many of these distressed homes are probably significantly below the previous conforming limit and were probably purchased with subprime loans.
Naturally the areas with a higher percentage of distressed properties have seen faster price declines. Of course those areas also saw the most appreciation because of loose underwriting for subprime lending. Here is a graph (from a post on Saturday) showing the real Case-Shiller prices in Los Angeles for three price ranges.
 This graph show the real Case-Shiller prices for homes in Los Angeles by price range.
 The low price range is less than $417,721 (current dollars). Prices in this range have fallen 34.9% from the peak in real terms.
The mid-range is $417,721 to $627,381. Prices have fallen 30.7% in real terms.
The high price range is above $627,381. Prices have fallen 22.8% in real terms.


