by Calculated Risk on 8/07/2008 05:21:00 PM
Thursday, August 07, 2008
2007 Vintage Mortgages
Update: Tanta comments:
I think the chart would be more helpful if it also included CLTV over this period.Original post:
(I'm sure CR didn't do that because UBS didn't report that data.)
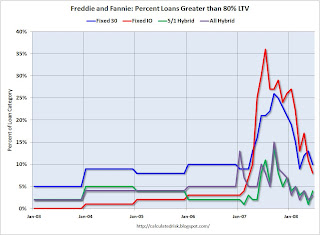
My sense is that those spikes in 2007 in high LTV are telling you the Day the Second Lien Lenders Died. (And the drop-off in high LTVs is telling you the Day the MIs Backed Off.)
In other words, my theory is that Freddie was mostly buying 80% LTV loans in 2003-2006 because that's what people were making. Nobody wanted a high LTV loan with MI when they could get these piggyback deals. If you looked at CLTV over this same period, I think it would show that.
So everybody's share of high LTV loans increased in 2007, because the supply of subordinate financing dried up.
End of the day, it doesn't explain the early DQ of the 2007 vintage for me because I suspect the CLTVs on the 2006 vintage were just as high.
 Click on table for larger image in new window.
This is a graph of the percent of Freddie Mac and Fannie Mae loans with a LTV greater than 80% (by loan category). The data is annual through 2006, and monthly starting in January 2007.
The graphs for low FICO loans, and greater than 90% LTV loans, are of similar shape, although the percentages are not as high.
This suggests that lending standards at Fannie and Freddie were relaxed in 2007, and have been tightened in 2008.
For the complete table, see: Fannie and Freddie: High LTV, Low FICO by Year
The WSJ's article on 2007 delinquencies: Mortgages Made in 2007 Go Bad at Rapid Clip
For Tanta's take on the WSJ article: 2007 Vintage: Nowhere to Go?
Tanta is suggesting 2007 vintage borrowers had nowhere to go - they couldn't refi, they couldn't sell, they couldn't access their HELOC - and this might be causing the higher delinquencies in 2007. The graph above suggests that the looser lending standards at Fannie and Freddie might have contributed too.


