by Calculated Risk on 8/12/2008 08:54:00 AM
Tuesday, August 12, 2008
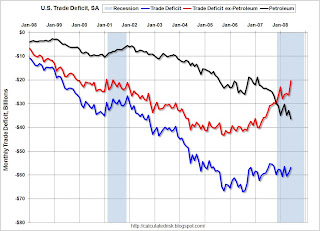
June Trade Deficit: $56.8 billion
The Census Bureau reports:
[T]otal June exports of $164.4 billion and imports of $221.2 billion resulted in a goods and services deficit of $56.8 billion, down from $59.2 billion in May, revised. June exports were $6.4 billion more than May exports of $158.0 billion. June imports were $3.9 billion more than May imports of $217.2 billion.Non-petroleum imports (corrected) are dropping sharply, although petroleum imports (in dollars) were up in June. Import oil prices hit a record $117.13 per barrel in June, and will increase further in July (when spot prices peaked).
Note: import oil prices are calculated when oil is delivered, so there is a lag between future prices and import prices.
 Click on table for larger image in new window.
This graph shows the U.S. trade deficit through June. The blue line is the total deficit, and the black line is the petroleum deficit, and the red line is the trade deficit ex-petroleum products. The current probable recession is marked on the graph.
The oil deficits in July and probably August will be ugly, but it now looks like the oil deficit will decline sharply later this year. As I noted last week, there are other factors that impact exchange rates, but this decline in oil prices will have a significant impact on the overall deficit, and this might mean the dollar has finally bottomed.


