by Calculated Risk on 9/30/2008 04:19:00 PM
Tuesday, September 30, 2008
Estimating PCE Growth for Q3 2008
With the focus on the bailout bill yesterday, the August release from the Bureau of Economic Analysis (BEA) of personal income and outlays almost went unnoticed.
Asha Bangalore at Northern Trust noticed:
The July-August data point to a possible drop in consumer spending during the third quarter. If the forecast is accurate, it would be the first quarterly decline since fourth quarter of 1991. Given the importance of consumer spending in GDP, a drop in consumer spending in the third quarter raises the probability of a contraction in real GDP in the third quarter.I wrote:
This report is strong evidence that the U.S. economy is in recession and that the change in Personal Consumption Expenditures (PCE) will be negative for Q3.Let me explain why:
The BEA releases Personal Consumption Expenditures monthly as part of the Personal Income and Outlays report, and quarterly as part of the GDP report (also released separately quarterly).
You can use the monthly series to exactly calculate the quarterly change in PCE as reported in the GDP report. However, the quarterly change is not calculated as the change from the last month of one quarter to the last month of the next quarter. Instead, you have to average all three months of a quarter, and then take the change from the average of the three months of the preceding quarter.
So, for Q3, you would average real PCE for July, August and September, and then divide by the average for April, May and June. Of course you need to take this to the fourth power (for the annual rate) and subtract one (for a percentage increase). This gives the real annualized rate of change for the quarter as reported in the GDP report.
Of course the report for September hasn't been released yet, and will not be released until after the advance Q3 GDP report is released on October 30th. As an estimate, we can use the change from April to July, and the change from May to August (the Two Month Estimate) to approximate PCE growth for Q3.
 Click on graph for larger image in new window.
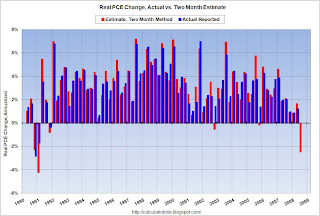
This graph shows the two month estimate versus the actual change in real PCE. The correlation is high (0.924).
Sometimes the growth rate for the third month of a quarter is substantially stronger or weaker than the first two months. As an example, in Q3 2005, PCE growth was strong for the first two months, but slumped in September because of hurricane Katrina. So the two month estimate was too high.
And the following quarter (Q4 2005), the two month estimate was too low. The first two months of Q4 were negatively impacted by the hurricanes, but real PCE growth in December was strong.
You can see a similar pattern in Q3 2001 because of 9/11.
But in general, the two month estimate is pretty accurate. Maybe September was exceptionally strong (very unlikely from anecdotal evidence), or maybe July and August will be revised upwards, but the two month estimate suggests real PCE will decline in Q3 by about 2.4% (annual rate).
Since PCE accounts for about 71% of GDP, this also suggests the change in real GDP in Q3 might be negative. This depends on exports and changes in inventories (investment will be weak).
If accurate, this will be the first decline in PCE since Q4 1991. This is strong evidence that the indefatigable U.S. consumer is finally throwing in the towel.


