by Calculated Risk on 9/08/2008 12:56:00 PM
Monday, September 08, 2008
Housing: It's about prices ...
"Our economy and our markets will not recover until the bulk of this housing correction is behind us."So when will the "bulk of this housing correction" be behind us? Right now prices are still too high.
Treasury Secretary Hank Paulson, Sept 7, 2008
Here are a few ways to look at house prices: real prices (inflation adjusted), price-to-rent ratio, and price-to-income ratio.
The first graph compares real and nominal Case-Shiller Home Prices through Q2 2008 (real is current index adjusted using CPI less Shelter).
 Click on graph for larger image in new window.
In real terms (red line), the Case-Shiller National Home price index is off 25% from the peak. Real prices are now back to the Q4 2002 level (nominal prices are back to mid-2004).
This suggests real prices, based on the Case-Shiller index, could fall substantially, perhaps 15% to maybe even 30% more. This decline would probably be some combination of falling nominal prices and more inflation. And prices could definitely overshoot to the downside.
 The second graph shows the price to rent ratio (Dec 1982 = 1.0) for both the OFHEO House Price Index and the Case-Shiller National Home Price Index. For rents, the national Owners' Equivalent Rent from the BLS is used. This graph is from this earlier post.
Data is available quarterly for the Case-Shiller National Index starting in 1987. For this graph, the price-to-rent ratio for Case-Shiller in Q1 1987 was set to the OFHEO price-to-rent for Q1 1987.
Looking at the price-to-rent ratio based on the Case-Shiller index, the adjustment in the price-to-rent ratio is probably 60% complete as of Q2 2008 on a national basis. This ratio will probably continue to decline with some combination of falling prices, and perhaps, rising rents. And the ratio may overshoot too.
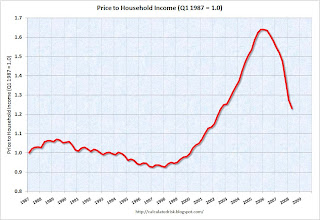
 The third graph shows the price-to-income ratio and is based off the Case-Shiller index, and the Census Bureau's median income Historical Income Tables - Households.
Using national median income and house prices provides a gross overview of price-to-income (it would be better to do this analysis on a local area). However this does shows that the price-to-income is still too high, and that this ratio needs to fall another 20% or so. Once again this could be a combination of falling prices and rising incomes (Note: this uses nominal incomes, and even if real incomes are stagnate or declining, nominal incomes are rising).
So by these three measures, prices have a ways to fall.
And finally, as long as inventory levels are substantially above normal (especially inventories of distressed properties), prices will probably continue to decline. So this graph is very useful:
 The final graph shows the 'months of supply' metric for existing homes for the last six years.
Months of supply increased to 11.2 months. A normal range is 5 to maybe 8 months. Until the months of supply decreases to the normal range, prices will continue to fall.
How much longer will prices fall? How much further will prices decline? No one knows, but these graphs suggest we still have a ways to go.


