by Calculated Risk on 9/17/2008 04:27:00 PM
Wednesday, September 17, 2008
S&P 500: 25% Off Sale
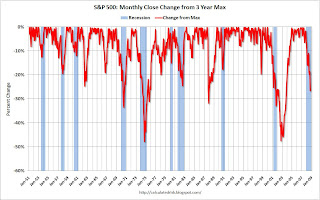
The S&P 500 closed 26.6% below the peak of last year.
The following graph shows the monthly closing change in the S&P 500 from the peak of the previous 3 years. This is a little unusual way to look at stock market correction. Since this uses monthly closing data, the worst declines aren't captured, but it gives an idea of the relative percentage losses in each bear market.  Click on graph for larger image in new window.
Currently the market decline is the fifth worst on a percentage basis since 1950.
The worst sell-offs were the decline during the '73-'75 recession, and the recent bust of the stock bubble. The next worst percentage declines happened during the '69-'70 recession, and the 1987 stock market correction (with no recession). This is clearly a significant bear market.


