by Calculated Risk on 10/07/2008 08:18:00 PM
Tuesday, October 07, 2008
The Export Slowdown
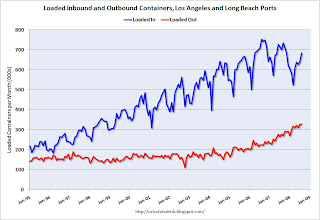
This graph shows the combined loaded inbound and outbound traffic at the ports of Long Beach and Los Angeles in TEUs (TEUs: 20-foot equivalent units or 20-foot-long cargo container). Although containers tell us nothing about value, container traffic does give us an idea of the volume of goods being exported and imported. Click on graph for larger image in new window.
Inbound traffic grew quickly for a number of years, but appears to be declining (there is a strong seasonal component). Inbound traffic is off about 6% from 2007 (using the last two months of July and August).
Outbound traffic was flat for years, but has been increasing the last few years. Outbound traffic is up 20% from 2007.
However it appears export growth will be slowing. From the WSJ: Slowing Export Machine Is Starting to Sputter
Export growth is expected to fall sharply in coming months ... Many U.S. producers are already seeing a slump in new orders ... The outlook has dimmed so quickly that economists are having a hard time keeping their projections current.
...
The upshot is that exports will no longer serve as the counterweight to weakness in the domestic economy. Over the past year, real goods exports surged by $114 billion, or 12%, up across every major category. They now make up nearly 13.5% of gross domestic product, the highest percentage since World War II.
 The second graph shows imports and exports as a percent of GDP since 1947 through Q2 2008.
Over the years, both exports and imports have increased as a percent of GDP. Exports now make up almost 13.5% of GDP (imports as a percent of GDP are at 18.5%). With the decline in oil prices - and the weaker U.S. economy - imports as a percent of GDP will probably decline over the next year.
With the global slowdown, export growth will also slow, and might even decline too. This has been a key source of strength for the U.S. economy, and especially for manufacturing employment.


