by Calculated Risk on 11/06/2008 10:16:00 AM
Thursday, November 06, 2008
Credit Crisis Indicators: More Progress
The U.S. economy is already in a recession, and the employment report tomorrow will probably be grim (Goldman Sachs is estimating 300 thousand in job losses in October). However, as bad as the economy currently is, without some improvement in the credit markets, the current recession will be much much worse.
Fortunately there have been some signs of a thaw in the credit markets over the last couple of weeks. Unfortunately most of the improvement has to do with the Fed intervening in rates and not due to lending between private parties. So there is still a long way to go ...
Three-month LIBOR rates for U.S. dollars fell to 2.3875% from 2.51%, well off the highs of 4.82% reached last month.The three-month LIBOR was at 2.51 yesterday. The rate peaked at 4.81875% on Oct. 10. (Better)

Click on graph for larger image in new window.
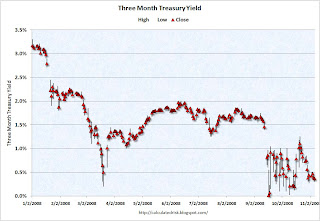
This graph shows the high, low, and the close for the three month treasury bill since the beginning of the year.
A good sign would be if the daily volatility subsides, and the yield moves up closer to the target Fed funds rate, or about 0.75%.
The yield is too low, but the daily volatility has declined.
Usually the 3 month trades below the target Fed Funds rate by around 25 bps, so this is too low with the Fed funds rate at 1.0%. However, the effective Fed Funds rate is even lower (0.23% yesterday), so maybe the 3 month yield of 0.37% is somewhat in the right range. I'd also like to see the effective Fed Funds rate move closer to the target rate (1.0% currently).
 This graph from Bloomberg shows the TED spread over the last year.
The TED spread is almost back to 2.0, but still too high. The peak was 4.63 on Oct 10th.
I'd like to see the spread move back down to 1.0 or lower.
Here is a list of SFP sales. No announcement today from the Treasury ... (no progress).
Note: Once a week I will include the Fed balance sheet assets. If this starts to decline that would be a positive sign.
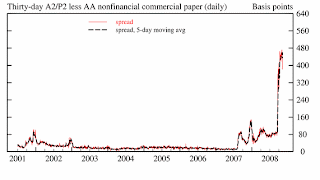
 Graph from the Fed.
This is the spread between high and low quality 30 day nonfinancial commercial paper.
The Fed is buying higher quality commercial paper (CP) and this is pushing down the yield on this paper (0.83% yesterday!) - and increasing the spread between AA and A2/P2 CP. So this indicator has been a little misleading. But it now sounds like the Fed might intervene in other companies and just the talk of possible Fed action is probably pushing down the A2/P2 rates. If the credit crisis eases, I'd expect a significant decline in this spread.
The LIBOR is down, the TED spread is off again, the A2/P2 spread declined - so there is more progress.


