by Calculated Risk on 11/17/2008 12:43:00 AM
Monday, November 17, 2008
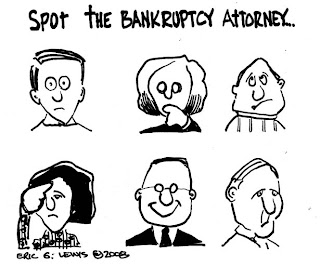
Spot the Bankruptcy Attorney
 | Click on cartoon for larger image in new window. Another great cartoon from Eric G. Lewis, a freelance cartoonist living in Orange County, CA. |
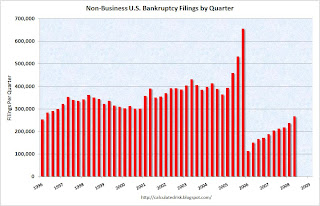
For anyone who missed it, on Saturday I posted the following graph of non-business bankruptcies by quarter (see NY Times: The Debt Trap)
 This graph shows the non-business bankruptcy filings per quarter since the beginning of 1996 through Q2 2008 (Source: USCourts.gov).
The spike in 2005 was because of people filing in advance of changes to the bankruptcy law.
According to the NY Times article "Downturn Drags More People Into Bankruptcy", filings were over 100 thousand in Oct 2008 and will probably be well over 300 thousand for Q4 2008 - so the graph is still trending up sharply.
Hence the smiling BK attorney ...


