by Calculated Risk on 1/02/2009 12:52:00 PM
Friday, January 02, 2009
S&P Case-Shiller House Price Graphs for October
Just catching up after my trip!
S&P/Case-Shiller released their monthly Home Price Indices for October earlier this week. This includes prices for 20 individual cities, and two composite indices (10 cities and 20 cities). Note: This is not the quarterly national house price index. Click on graph for larger image in new window.
The first graph shows the nominal Composite 10 and Composite 20 indices (the Composite 20 was started in January 2000).
The Composite 10 index is off 25.0% from the peak.
The Composite 20 index is off 23.4% from the peak.
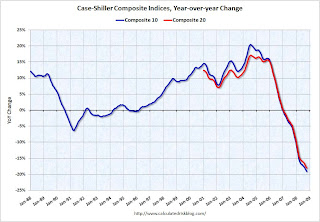
Prices are still falling, and will probably continue to fall for some time.  The second graph shows the Year over year change in both indices.
The Composite 10 is off 19.1% over the last year.
The Composite 20 is off 18.0% over the last year.
These are the worst year-over-year price declines for the Composite indices since the housing bubble burst.
The following graph shows the price declines from the peak for each city included in S&P/Case-Shiller indices. In Phoenix, house prices have declined more than 40% from the peak. At the other end of the spectrum, prices in Charlotte and Dallas are only off about 4% to 6% from the peak.
This shows the difference between the bubble areas (Krugman in 2005 called the "Zoned Zones") and the "Flatland" areas.
There was a bubble in Flatland too caused by the rapid migration from renting to buying - facilitated by loose lending - that pushed up Flatland prices. But those bubbles were small compared to the bubbles in the Zoned Zones.
Now that the bubble has burst, prices in the more bubbly Zoned Zones are falling much more than in Flatland.
Detroit is an exception with prices off 29% from the peak, even though Detroit never had a price bubble. The reason is Detroit has a weak economy and a declining population. Since housing is very durable, there is excess supply in Detroit, and prices for existing homes are below replacement costs.
Another exception is New York. Prices in New York are only off 11.4% even though New York is part of the Zoned Zone. New York had a price bubble, but until recently prices had held up pretty well. This probably means New York house prices will decline by a larger percentage over the next year or two than other bubble areas ...


