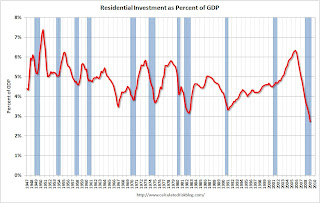
 Click on graph for larger image in new window.
Residential investment (RI) has been declining for 13 consecutive quarters, and Q1 2009 was the worst quarter (in percentage terms) of the entire bust. Residential investment declined at a 38% annual rate in Q1.
This puts RI as a percent of GDP at 2.7%, by far the lowest level since WWII.
 The second graph shows non-residential investment as a percent of GDP. All areas of investment are now cliff diving.
Business investment in equipment and software was off 33.8% (annualized), and investment in non-residential structures was off 44.2% (annualized).
The third graph shows the contribution to GDP from residential investment, equipment and software, and nonresidential structures. The graph shows the rolling 4 quarters for each investment category.
This is important to follow because residential tends to lead the economy, equipment and software is generally coincident, and nonresidential structure investment trails the economy.
 Residential investment (red) has been a huge drag on the economy for the last couple of years. The good news is the drag on GDP will probably be getting smaller going forward.
 Even if there is no rebound in residential investment later this year, the drag will be less because there isn't much residential investment left! The bad news is any rebound in residential investment will probably be small because of the huge overhang of existing inventory.
As expected, nonresidential investment - both structures (blue), and equipment and software (green) - fell off a cliff. In previous downturns the economy recovered long before nonresidential investment in structures recovered - and that will probably be true again this time.
As always, residential investment is the most important investment area to follow - it is the best predictor of future economic activity.