by Calculated Risk on 6/16/2009 03:18:00 PM
Tuesday, June 16, 2009
Tiered House Prices
In the previous post, I disagreed a little with the JPMorgan analysts - I noted:
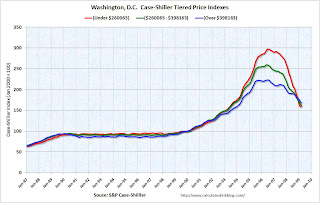
Prices increased more in percentage terms in the low priced areas of California (like the Inland Empire and Sacramento) than in the high priced coastal areas. So prices will probably fall further in percentage terms from the peak in the low priced areas.Case-Shiller has some tiered house price indices for a number of cities, and most of the bubble cities show this pattern (more appreciation in the low priced areas).
 | Click on graph for larger image in new window. Here are a few select cities. The first is Washington, D.C. Note the price range of the tiers changes by city. |
The second graph is for Miami. |  |
 | The third graph is for San Francisco. Most other bubble areas show a similar pattern of larger percentage price increases for the lower tier. |


