by Calculated Risk on 7/27/2009 11:38:00 AM
Monday, July 27, 2009
Distressing Gap: Ratio of Existing to New Home Sales
For graphs based on the new home sales report this morning, please see: New Home Sales increase in June, Highest since November 2008
Last week the National Association of Realtors (NAR) reported that distressed properties accounted 31 percent of sales in June. Distressed sales include REO sales (foreclosure resales) and short sales, and based on the 4.89 million existing home sales (SAAR) that puts distressed sales at about a 1.5 million annual rate in June.
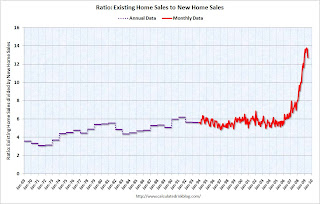
All this distressed sales activity has created a gap between new and existing sales as shown in the following graph that I've jokingly labeled the "Distressing" gap.
This is an update including June new and existing home sales data. Click on graph for larger image in new window.
This graph shows existing home sales (left axis) and new home sales (right axis) through June.
As I've noted before, I believe this gap was caused by distressed sales - in many areas home builders cannot compete with REO sales, and this has pushed down new home sales while keeping existing home sales activity elevated.  The second graph shows the same information, but as a ratio for existing home sales divided by new home sales.
Although distressed sales will stay elevated for some time, eventually I expect this ratio to decline back to the previous ratio. The small decline in June ratio was because of the increase in new home sales.
The ratio could decline because of increase in new home sales, or a decrease in existing home sales - or a combination of both.  The third graph shows the ratio back to 1969 (annual data before 1994).
Note: the NAR has changed their data collection over time and the older data does not include condos: Single-family data collection began monthly in 1968, while condo data collection began quarterly in 1981; the series were combined in 1999 when monthly collection of condo data began.


