by Calculated Risk on 8/25/2009 02:25:00 PM
Tuesday, August 25, 2009
Case-Shiller House Prices and Stress Test Scenarios
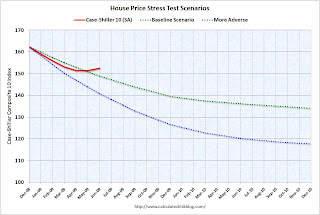
This following graph compares the Case-Shiller Composite 10 SA index with the Stress Test scenarios from the Treasury (stress test data is estimated from quarterly forecasts). The Stress Test scenarios use the Composite 10 index and start in December. Here are the numbers:
Case-Shiller Composite 10 Index, June: 152.55
Stress Test Baseline Scenario, June: 148.82
Stress Test More Adverse Scenario, June: 140.71
Unlike with the unemployment rate (worse than both scenarios), house prices are performing better (from the perspective of the banks) than the the stress test scenarios. I believe there will be further price declines later this year, because I think the Case-Shiller seasonal adjustment is insufficient, and because I expect the first-time home buyer frenzy to slow just as more distressed supply comes on the market - even if an extension to the tax credit is passed.


