by Calculated Risk on 8/24/2009 10:33:00 AM
Monday, August 24, 2009
Chicago Fed: July National Activity Index
From the Chicago Fed: Index shows economic activity improved in April
The Chicago Fed National Activity Index was –0.74 in July, up from –1.82 in June. All four broad categories of indicators improved in July, while three of the four continued to make negative contributions to the index. Production-related indicators made a positive contribution to the index for the first time since October 2008 and for only the second time since December 2007.
 Click on table for larger image in new window.
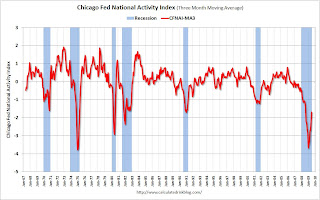
This graph shows the Chicago Fed National Activity Index (three month moving average) since 1967. According to the Chicago Fed:
"[T]he Chicago Fed National Activity Index (CFNAI), is a weighted average of 85 existing, monthly indicators of national economic activity. The CFNAI provides a single, summary measure of a common factor in these national economic data ...
[T]he CFNAI-MA3 appears to be a useful guide for identifying whether the economy has slipped into and out of a recession. This is useful because the definitive recognition of business cycle turning points usually occurs many months after the event. For example, even though the 1990-91 recession ended in March 1991, the NBER business cycle dating committee did not officially announce the recession’s end until 21 months later in December 1992. ...
When the economy is coming out of a recession, the CFNAI-MA3 moves significantly into positive territory a few months after the official NBER date of the trough. Specifically, after the onset of a recession, when the index first crosses +0.20, the recession has ended according to the NBER business cycle measures."
Note: this is based on only a few recessions, but this is one of the indicators to watch to determine when the recession ends. This suggests the economy was still in recession in July.
Of course this says nothing about economic purgatory ...


