by Calculated Risk on 8/03/2009 07:42:00 PM
Monday, August 03, 2009
Market and Credit Indicators
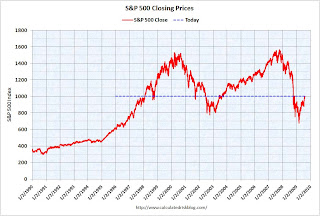
The S&P 500 closed above 1000 for the first time since last November. Click on graph for larger image in new window.
The first graph shows the S&P 500 since 1990.
The dashed line is the closing price today.
The S&P 500 is up 48.2% from the closing bottom (326 points), and off 36% from the peak (563 points below the closing max).
The S&P 500 first hit this level in Feb 1998; over 11 years ago.
The British Bankers' Association reported that the three-month dollar Libor rates were fixed at a new record low of 0.472%. The LIBOR peaked at 4.81875% on Oct 10, 2008.  The A2P2 spread has declined to 0.26. The record (for this cycle) was 5.86 after Thanksgiving, and this is only slightly above the normal spread of around 20 bps.
This is the spread between high and low quality 30 day nonfinancial commercial paper.
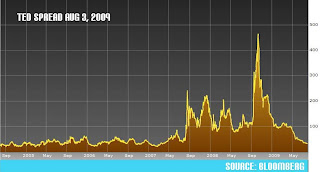
Meanwhile the TED spread has decreased further and is now at 29.4. This is the difference between the interbank rate for three month loans and the three month Treasury.
The peak was 463 on Oct 10th and the spread is now in the normal range. The final graph shows the spread between 30 year Moody's Aaa and Baa rated bonds and the 30 year treasury.
The spread has decreased sharply over the last few months. The spreads are still high, especially for lower rated paper.
The Moody's data is from the St. Louis Fed:
Moody's tries to include bonds with remaining maturities as close as possible to 30 years. Moody's drops bonds if the remaining life falls below 20 years, if the bond is susceptible to redemption, or if the rating changes.Some of these indicators will be interesting to follow when the Fed eventually unwinds their current positions.


