by Calculated Risk on 8/13/2009 08:31:00 AM
Thursday, August 13, 2009
Retail Sales Decline Slightly in July
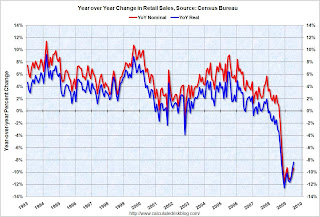
On a monthly basis, retail sales decreased 0.1% from June to July (seasonally adjusted), and sales are off 8.3% from July 2008 (retail ex food services decreased 9.3%).
The following graph shows the year-over-year change in nominal and real retail sales since 1993. Click on graph for larger image in new window.
To calculate the real change, the monthly PCE price index from the BEA was used (July PCE prices were estimated as the average increase over the previous 3 months).
Real retail sales declined by 8.4% on a YoY basis. The second graph shows real retail sales (adjusted with PCE) since 1992. This is monthly retail sales, seasonally adjusted.
NOTE: The graph doesn't start at zero to better show the change.
This shows that retail sales fell off a cliff in late 2008, and may have bottomed - but at a much lower level.
Here is the Census Bureau report:
The U.S. Census Bureau announced today that advance estimates of U.S. retail and food services sales for July, adjusted for seasonal variation and holiday and trading-day differences, but not for price changes, were $342.3 billion, a decrease of 0.1 percent (±0.5%)* from the previous month and 8.3 percent (±0.7%) below July 2008. Total sales for the May through July 2009 period were down 9.0 percent (±0.5%) from the same period a year ago. The May to June 2009 percent change was revised from +0.6 percent (±0.5%) to +0.8 percent (±0.2%).Maybe the cliff diving is over, but retail sales are still at the bottom of the cliff ...


